
“I can calculate the movement of stars, but not the madness of men.”
Introduction
It was the best of markets, it was the worst of markets in 2018. After starting the year with an 11.5% return through three quarters, the benchmark finished 2018 with a decline of 20.3% – and fell, at one point, more than 27% from its peak. Although unpleasant, price declines such as the one experienced in the fourth quarter are quite common. In fact, the index has experienced similar drawdowns at least three times since the current bull market began almost ten years ago, including a 20% drop in 2010, a 30% decline in 2011, and a 24% decrease in early 2016. As a result, we can be certain that coping with stock market volatility is simply the cost of admission for equity investors like us.
However, as active investors we are not completely powerless to the whims of the market. We can take advantage of dislocations by positioning the portfolio properly for big market swings. For example, given what we perceived as an elevated risk of a market decline, we maintained a relatively large cash position – 10% of the portfolio – entering the fourth quarter. As prices fell, this cash position served two purposes. First, it helped cushion the impact of falling equity prices by outperforming the general market. And second, it gave us the ability to opportunistically add to our stock positions as prices became more attractive. At Kehlet Capital our goal is to enhance the performance of the portfolio by adjusting the cash position between 0% and 20% based on our long-term views of the market.
We were fortunate to have been prepared for the recent decline. But our good fortune begs the question, “how can one know whether a stock (or the stock market) is more likely to increase or decrease over the long-term?” To answer that we need to first call attention to an important investing concept articulated by Warren Buffett; price is what you pay, value is what you get. In other words, the price of a stock does not always reflect its intrinsic value – a quantity determined by the future cash flows of the business. But even though the stock price is not always equal to the intrinsic value, it is frequently tethered to it. Like a dog on a leash, stock prices are free to move around their intrinsic value owners in any direction that grabs their attention. However, if prices stray too far ahead or too far behind, they are likely to be reeled back in by the forces of supply and demand. As a result, short-term price movements can be random and nearly impossible to forecast, while long-term price movements regularly trend toward their intrinsic values. Therefore, stock prices should only be viewed in comparison to intrinsic value because without that foundation stock price movements are virtually meaningless.
How then does one determine intrinsic value? The short answer is that it is the sum of all future cash flows discounted by a required rate of return. For equities however, this simple calculation can be a massively complex and difficult task due to the uncertainty that exists regarding a company’s future cash flows. Unlike the cash flows of bonds, which have a specified magnitude and timing, the cash flows of businesses are dependent on numerous factors – including many outside a company’s control (e.g., competition, the economy, new technology, new regulations, etc.). This can make them highly variable and unpredictable. As a result, determining the intrinsic value of a stock is not an exact science. It is best thought of as producing a range of values rather than a precise number. Our goal as investors is to determine the appropriate range as accurately as possible in order to identify situations where meaningful mispricing exists. At Kehlet Capital we think this feat is best accomplished by:
Seeking information from as many sources as possible. Simply put, the best valuation efforts start by creating a mosaic of both material public information and non-material non-public information to paint a complete picture of the business in question and minimize the uncertainty surrounding its future cash flows. This is precisely why, at Kehlet Capital, we evaluate the companies in our portfolio extensively, performing boots-on-the-ground research and seeking out industry experts, company executives, employees, customers, and suppliers; to aggregate information and come to the most accurate conclusion about the company as possible.
Merging the narrative with the numbers. In general, when it comes to estimating intrinsic value there are two types of people: Storytellers and Number Crunchers1. And each type has their own strengths and weaknesses. For example, Storytellers tend to be more convincing since their conclusions are backed by well-reasoned arguments. But they often wander into fantasyland by creating stories that are difficult to justify with data. On the other hand, Number Crunchers are usually well grounded but can be too dependent on data, causing them to miss important changes in the market. Consequently, the key to a good valuation is bridging the gap between the numbers and the story. That is, identifying which parts of the forecast are probable, which are plausible, and which are possible and incorporating them into the valuation model appropriately. This ensures that the estimated intrinsic value is not only realistic but logical and accurate.
Using multiple valuation methods. There are two main approaches to equity valuation: 1) absolute value, and 2) relative value. And within each of these categories are multiple valuation methods and techniques (e.g., DCF analysis, comparable company analysis, sum of the parts, etc.). Each method has its own unique strengths and weaknesses. For example, comparable company calculations are generally simple to perform but can be misleading if the comparisons are mispriced or inappropriate. On the other hand, discounted cash flow analysis is highly precise but can be complex and sensitive to small changes in any number of assumptions. As result, multiple valuation techniques should be used when possible to increase one’s confidence in the intrinsic value estimate.
At Kehlet Capital we believe the best investors are those who most accurately recognize wide discrepancies between price and intrinsic value and have the patience and fortitude to wait until those discrepancies converge. Therefore, when we started the firm nearly two years ago, we set out to implement a disciplined and consistent approach to valuation that would help us outperform our benchmark across market cycles. Based on the results through two years we feel good about the path we are on. Although there is no guarantee that future investment results will be satisfactory, we believe our commitment to executing the process described above will help us navigate through periods of significant market volatility and provide our partners with the greatest potential for long-term success.
Performance
| Year | KCM Composite, Net | IWM | Excess Return |
|---|---|---|---|
| 2017* | 27.20% | 14.26% | +12.94% |
| 2018 | -3.43% | -11.11% | +7.68% |
| Annualized | 11.35% | 0.82% | +10.53% |
*Inception date: 02/01/2017
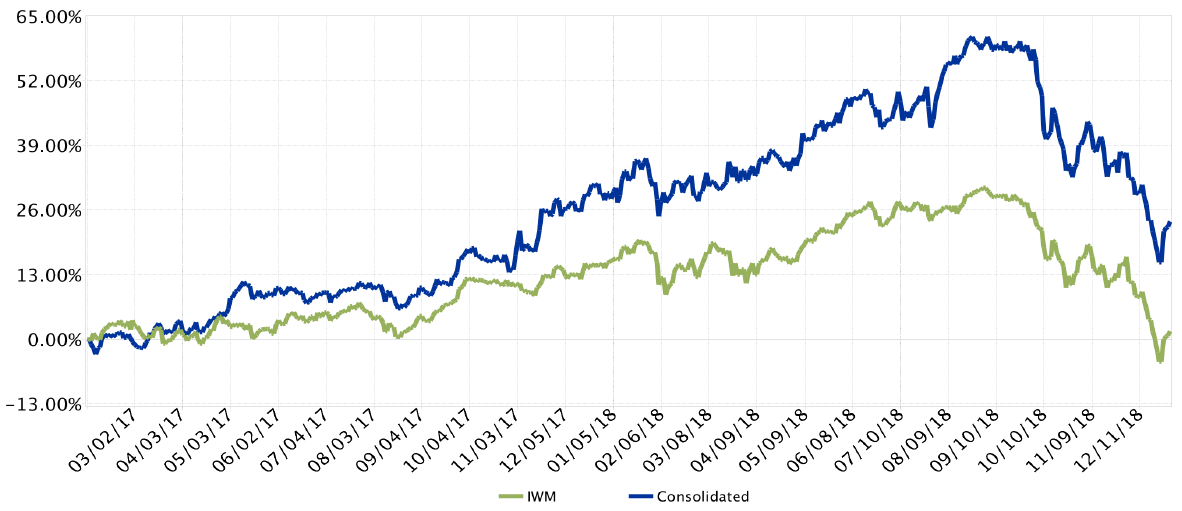
During the fourth quarter Kehlet Capital Management’s concentrated micro-cap composite declined 22.30%, underperforming the benchmark which decreased 20.29%. However, for the full year 2018 the KCM micro-cap composite declined 3.48%, outperforming the benchmark which decreased 11.11%.
The largest contribution to performance in the fourth quarter came from NRC Health (NRC), which returned 0.55%. NRC Health is a healthcare consulting firm that focuses on providing analytics and insights primarily in the areas of patient experience and patient satisfaction. Most of the company’s business stems from the administration and processing of patient surveys mandated by the Centers for Medicare and Medicaid Services (“CMS”). Although this may seem like a relatively commoditized activity at first glance, there are several factors that make it quite attractive.
First, it has limited competition. The business is essentially a duopoly between NRC Health and Press Ganey. This is primarily the result of two factors: 1) The obstacles new competitors face obtaining CMS certification. That is, in order to conduct CMS mandated surveys a company must first be a certified CMS vendor. But certification requires meeting numerous criteria, including a minimum of three years’ prior experience conducting patient surveys. Therefore, new competitors attempting to break into the space have a chicken and the egg type problem. They need experience to get certified but are likely to face extreme resistance to gaining experience without certification. And 2) The difficulties new competitors have stealing market share. In other words, customers tend to be quite loyal to their current provider since the benefits of switching to a competitor are typically viewed as minimal. As with a checking account, customers rarely change vendors even when presented with other seemingly reasonable options. Accordingly, the industry enjoys retention rates of more than 90%. Therefore, any new competitors that defy the odds to achieve CMS certification then face the grim prospect of trying to steal loyal customers away from NRC and Press Ganey. Consequently, few companies have attempted to build a presence in the space and even fewer have been successful.
The second factor that makes the business attractive is that it is both asset-light, due to the limited need for fixed assets, and capital-light, due to NRC’s subscription-based model (i.e., they are paid in advance for service performed throughout the year). These two features combine to provide extremely high returns on limited incremental capital investment.
And third, the business is at the center of a shift in the healthcare industry, providing meaningful opportunity for growth. For example, the healthcare industry has historically operated as a fee-for-service model, where providers were reimbursed for the services they delivered. However, this created perverse incentives for healthcare providers since they were paid for performing more (potentially unnecessary) services. And many people believed the system was a key driver of the rapid increase in healthcare costs. But recently the industry has shifted to a value-based care model, where healthcare reimbursement is tied directly to patient outcomes and the quality of care, rather than the number of services performed. As a result, patient surveys, such as the ones administered by NRC, are being mandated across an expanding subset of the healthcare industry and providers are taking it upon themselves to understand their customers at a deeper level.
We think these three factors – limited competition, an attractive business model, and meaningful growth opportunity – make NRC Health a business capable of compounding shareholder value for years to come.
Our largest contribution to performance for the full year 2018 was Hibbett Sports (HIBB) with an increase of 27.67%. Hibbett Sports is a sporting goods retailer in the Southeastern United States with over 1,000 stores and is a business we have followed for years. When we first acquired shares in the company, it was an attractive business. But, like nearly every retailer in the U.S., it was struggling in the face of rising competition from e-commerce. These headwinds had put severe downward pressure on the stock and drove the price to what we felt were truly ridiculous levels. We decided to initiate a position in the company in August 2017 for just under $12 per share. Shortly thereafter, Hibbett launched its own previously announced e-commerce platform which saw significant early success. This caused market sentiment to turn quickly and drove the price up rapidly. However, based on our long-term views and the limited advantages we saw for Hibbett in the e-commerce channel, we felt that the stock price had gone too far in the opposite direction. We exited our position in May 2018 at more than $26 per share for a gain of 117% in just over nine months.
Our worst performer for the quarter and the full year 2018 was Coherent Inc. (COHR) with a decline of 38.51% and 39.26%, respectively. Coherent is a provider of laser-based technologies for a broad range of commercial, industrial and scientific applications. Their lasers are used for applications such as DNA sequencing, vision correction, welding and cutting, and even hair and tattoo removal. However, their largest market is in the manufacturing and inspection of microelectronics, where they make the only high-energy lasers suitable for the production of OLED flat panel displays.
For those unfamiliar, OLED is the next-generation of display technology for TV’s, smartphones, watches, and tablets. It provides clearer and more vibrant picture quality than current LCD screens, allows for thinner (even bendable or foldable) screen designs and uses about 40% less energy. The downside is that it currently costs about twice as much to produce. But the cost difference between LCD and OLED is closing quickly, which is leading to increased adoption of OLED. For instance, while Samsung has used OLED’s in their smartphones for years, Apple only recently started moving in that direction with the introduction of the iPhone X in late 2017. And the company has continued the trend toward OLED with two of its newest smartphones – the iPhone Xs and Xs Max.
As a result, the long-term prospects for OLED (and Coherent) are highly favorable. In the short-term however, the smartphone market is in the midst of a significant slowdown. As a result, smartphone makers such as Samsung and Apple have reduced their spending plans for capital equipment. Therefore, Coherent’s earnings are almost certain to decline in 2019. This prospect weighed heavily on the company’s stock price in the fourth quarter. However, based on our long-term views and our estimate of Coherent’s intrinsic value, we think the selloff is overdone. And what we originally saw as an attractive investment has become almost absurdly cheap. Nevertheless, we would not be surprised if the stock price declined even further as the market focuses on short-term headwinds in the smartphone market. But we feel strongly that our patience will pay off in the long-run as the industry recovers and OLED rapidly gains adoption.
Conclusion
The fourth quarter brought significant volatility. But our ability as active investors to prepare for adverse events allowed us to weather the storm and outperform for the full year. We will continue to follow a disciplined and consistent approach to valuation while working to find situations with wide discrepancies between price and intrinsic. Though we cannot guarantee future results will be satisfactory, we feel good about the path we are on. As always, thank you for supporting Kehlet Capital Management. If you have any questions or comments, please do not hesitate to contact us.
Notes
- Aswath Damodaran, Narrative and Numbers: The Value of Stories in Business, (Columbia University Press, 2017) ↩
Disclosures to Performance Results
Actual composite performance results represent the performance of fully discretionary accounts managed by Kehlet Capital Management (KCM) during the corresponding time period. The composite performance results reflect time-weighted rates of return, the reinvestment of dividends and other account earnings. The reinvestment of dividends and other earnings may have a material impact on overall returns.
Past performance is not indicative of future results and the performance of a specific individual client account may vary substantially from the composite performance results. Therefore, no current or prospective client should assume that future performance will be profitable, or equal either the KCM composite performance results reflected above, or the performance results for any of the comparative index benchmarks provided.
For reasons including variances in portfolio account holdings, variances in the investment management fee incurred, market fluctuations, the date on which a client engages KCM’s investment management services, and any account contributions or withdrawals, the performance of a specific client’s account could vary substantially from the indicated KCM composite performance results. A portion of each account can be actively managed in an attempt to respond to changing conditions.
All performance results have been compiled solely by KCM, are unaudited, and have not been independently verified. Therefore, the performance data could be wrong. Information pertaining to KCM’s advisory operations, services, and fees is set forth in KCM’s current Form ADV Part 2A disclosure brochure, a copy of which is available from KCM upon request.
iShares IWM is an exchange-traded fund (ETF) measuring the performance of approximately 2,000 small-cap companies. It serves as a benchmark for small-cap stocks in the United States.
KCM managed accounts may own assets and follow investment strategies which cause them to differ materially from the composition and performance of the ETF shown as a benchmark. The ETF was chosen for its accessibility, transparency, independence, and relevance to KCM’s investment strategy, but there may be other indices that are more appropriate or applicable to the Concentrated Micro-cap Strategy. The historical index performance results are provided exclusively for comparison purposes only, so as to provide general comparative information to assist an individual client or prospective client in determining whether a specific Portfolio meets, or continues to meet, his/her investment objective(s). It should not be assumed that account holdings will correspond directly to any of the comparative indexes.
Different types of investments and/or investment strategies involve varying levels of risk, and there can be no assurance that any specific investment or investment strategy (including the investments purchased and/or investment strategies devised by KCM) will be either suitable or profitable for a client’s or prospective client’s portfolio and may result in a loss of principal. Accordingly, no client or prospective client should assume that the above portfolios (or any component thereof) serve as the receipt of, or a substitute for, personalized advice from KCM, or from any other investment professional.