
“Big day of negotiations with China. They want to make a deal, but do I?”
| Callaway Golf Co. (ELY) | 16.2% |
|---|---|
| Coherent Inc. (COHR) | 13.1% |
| DXP Enterprises Inc. (DXPE) | 10.7% |
| Number of holdings | 11 |
|---|---|
| Median market cap | $862M |
| Weighted avg. market cap | $1,546M |
Introduction
For the last two years the trade war between the United States and China has dominated the headlines and seemingly driven every major stock market movement. But for many people the issues of foreign trade and its importance to the economy are unclear. Just how much trading do we do with China? Why are we in a trade war at all? How likely are we to reach a deal and what happens if we don’t? I’ll attempt to address these questions and more in the following paragraphs.
First, a few facts about foreign trade:
Total U.S. trade with foreign countries was $5.6T in 2018,1 or approximately 27% of U.S. GDP (i.e., the value of all goods and services produced)
Of this total, China was our largest trading partner with total trade of $737B, or almost 4% of GDP. They were followed closely by Canada ($725B) and Mexico ($678B). However, grouping together the countries in the European Union would make them our largest trading partner with $1.3T in total trade
Of the total trade with China, the U.S. imported $559B and exported $178B, resulting in a trade deficit (i.e., imports minus exports) of $381B. This compares to a trade deficit of $115B with the European Union, $79B with Mexico, and a trade surplus of $4B with Canada
The largest categories of imports from China were Consumer Goods ($248B) and Capital Goods ($200B)
Within these categories the largest product segments imported from China were computers & related accessories ($80B), cell phones ($72B), and apparel & footwear ($55B)
The largest categories of exports to China were Capital Goods ($53B) and Industrial Supplies ($40B)
Within these categories the largest product segments exported to China were aircraft, engines, equipment & parts ($18B) and oil, gas, and petroleum products ($8B)
So, what are the takeaways? First, at 27% of GDP, international trade is a critical part of the U.S. economy. Second, although China is our largest trading partner, it represents only 13% of total foreign trade and less than 4% of U.S. GDP. In fact, these numbers only represent direct trade with China. If we include indirect trade (i.e., when goods and services originate in one country but pass through another before entering the U.S.), China’s importance to the U.S. economy is estimated to be roughly half the size officially reported.2 This is primarily because China is the “Great Assembler”, with about one third of its export content coming from foreign countries. Take the iPhone for example. “When Apple’s iPhone is assembled in China and then shipped to the U.S., the factory cost of the iPhone (about $240) is added to the U.S. trade deficit with China. But the factory cost includes the cost of components to make the iPhone – such as the touchscreen display from Japan, processors from Taiwan and memory from South Korea – as well as the cost of assembling the components. However, the assembly cost is estimated at $8.46, or less than 4%, of the factory cost of an iPhone. In other words, the U.S. would run a $240 trade deficit in terms of gross trade with China, but only an $8.46 trade deficit in terms of value-added trade.”3 Therefore, although China is a valuable trading partner, its importance to the U.S. economy should not be overstated. And third, the trade relationship with China is severely out of balance. For example, despite representing 13% of total foreign trade, the country accounts for over 60% of the total U.S. trade deficit.
So, why are we in this trade war? Isn’t free trade beneficial for all? As the theory goes, if one country can cheaply produce a good, like oil, and another country can cheaply produce a different good, like coffee, they should trade their surpluses with each other. In this way each country benefits from inexpensive access to goods they would not otherwise have. And this is how we get wine from France, electronics from Korea, and oil from Saudi Arabia; by trading things like airplanes, medicine, automobiles, and soybeans. But most of the time the amount of trade between two countries is not perfectly even. In other words, one country will likely receive more than it ships out, resulting in a trade deficit. But trade deficits with individual countries are not necessarily a bad thing. They simply require a trade surplus somewhere else or the use of debt. For example, I have a trade deficit with my auto mechanic, but it is a deficit I am happy to maintain. He provides me a service even though I do not provide him with a service in return. Fortunately, I have a trade surplus with my employer which allows me to compensate my mechanic. However, if the surplus with my employer did not exist or was insufficient to cover my debt, I would need to borrow money from somewhere else. And that is precisely what the United States does. Because it has an overall trade deficit of $628B a year (over half of it coming from China), it must borrow money (ironically, much of it also coming from China) to pay off its debts. So even though individual trade deficits are not necessarily bad, overall deficits can be, since they require the growing use of debt. Therefore, even though economic theory says that free trade is a good thing, there can be situations where trade is detrimental. Like when a trading partner isn’t playing nice. For example, what if I discovered my mechanic was overcharging me, attempting to hack into my bank account, and secretly copying my house key in order to steal from me later? Should I continue to do business with him? Probably not. But economic theory does not assume countries break the rules. However, that is what China has been accused of doing for many years – stealing intellectual property and forcing companies to transfer their technology to Chinese businesses. And these actions have been estimated to cost the U.S. between $225B and $600B annually.4 As a result, the Trump administration began setting tariffs and other trade barriers on China in 2018 with the goal of forcing it to make changes to its “unfair trade practices”, including the growing trade deficit, the theft of intellectual property, and the forced transfer of American technology to China.
So, now that we are in a trade war, how likely are we to reach a deal? After almost two years of back and forth negotiations and escalating tariffs, China and the U.S. announced a “phase one” trade deal in December. President Trump declared that he will sign the agreement on January 15th, 2020 and begin “phase two” talks at a later date. Under the terms of the agreement, China will commit to increase imports of U.S. goods and services by $200B over the next two years, strengthen legal protections for intellectual property, and eliminate pressure on companies to transfer technology to Chinese firms. In return, the U.S. paused a 15% tariff scheduled to take effect last December on $156B in Chinese imports and reduced tariffs from 15% to 7.5% on $120B of Chinese imports. While risks to the deal remain, it is difficult to see the agreement as anything other than a huge victory for the United States. Effectively, the U.S. is reducing tariffs by $9B (i.e., 7.5% of $120B) in exchange for $200B in purchases from China plus potentially hundreds of billions of dollars worth of intellectual property protections. And while the phase one deal is an important first step, the trade war is far from over. However, the U.S. continues to have significant leverage in the ongoing negotiations. First, it still applies a 25% tariff on $250B of imported Chinese goods which can and almost certainly will be used as a bargaining chip. Second, China is significantly more dependent on the U.S. than the U.S. is on it. For example, China’s exports to the U.S. account for approximately 4% of its $13.6T GDP5. By contrast, U.S. exports to China represent less than 1% of its $20.6T GDP. In other words, China has nearly five times more at stake.
But the phase one deal could fall through at any moment and a phase two agreement is not guaranteed. So, what happens if the two countries are unable to reach a final long-term deal? Most economists agree that, in the short run, 1) overall prices would likely rise as some companies chose to pass tariff costs along to consumers, and 2) economic growth would slow as other companies decided to “eat the cost”. However, we think each of these outcomes would be mild for a couple of reasons. First, as mentioned previously, trade with China represents less than 4% of total GDP. So even if prices on all Chinese goods increased by 25% the result would likely be a less than 1% increase in overall prices (4% multiplied by 25%). In fact, data since the trade war began seems to support this conclusion as inflation has hovered around 2% since January 2018, despite increasing tariffs.6 Second, in the long-run, companies are likely to offset much of the trade headwinds by diverting their supply chains away from China. In fact, this process has already begun as numerous companies have announced plans to adjust their supply chains and find alternative sources of supply (e.g., from Vietnam, Mexico, Taiwan, etc.). And because China is the “Great Assembler”, we think a large portion of its supply chain can be relocated with minimal disruption and cost.
In the end, the downside risks from the trade war with China appear to be limited. But, based on the terms of the phase one agreement, the potential upside seems significant. As investors, we prefer these types of asymmetric payoffs and believe the long-term impact of the trade war is likely to be positive, even if it results in some (moderate) short-term pain. And though our domestically focused portfolio has minimal exposure to China, we will continue to monitor the situation in order to position the portfolio appropriately and provide our partners with the greatest potential for long-term success.
Performance
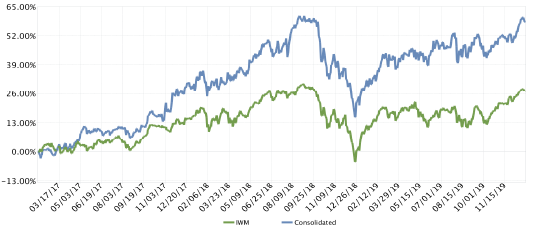
| Year | KCM Composite, Net | IWM | Excess Return |
|---|---|---|---|
| 2017* | 27.20% | 14.26% | +12.94% |
| 2018 | -3.43% | -11.11% | +7.68% |
| 2019 | 27.79% | 25.39% | +2.40% |
| Annualized | 16.74% | 8.66% | +8.08% |
*Inception date: 02/01/2017
During the fourth quarter of 2019, Kehlet Capital Management’s concentrated micro-cap composite returned 7.09%, underperforming the benchmark which returned 9.87%. For the full year 2019, the KCM composite grew 27.79% compared to an increase of 25.39% for the benchmark.
The largest contribution to performance came from Care.com (CRCM), which returned 43.70% during the quarter. As a reminder, Care.com is the largest online marketplace for finding and managing childcare. In the 2019 second quarter newsletter I outlined our long-term thesis on the company as well as the various accusations levied against it in a recent Wall Street Journal article. However, during the third quarter an activist investor named Engine Capital acquired a “sizable” stake in Care.com and issued an open letter to the company’s Board of Directors. In the letter, Engine Capital called on the Board to initiate a process to explore strategic alternatives, including a potential sale of the business. It also asserted that Care.com could be worth between $14 and $19 per share and suggested InterActiveCorp (NASDAQ: IAC) as a possible acquirer. One quarter later, Engine Capital got its wish when InterActiveCorp announced in December that it had reached an agreement to acquire Care.com for $15 per share. And although the stock jumped 13% the following day, the transaction price represented a 34% premium over Care.com’s “unaffected” closing price on October 25, 2019 (i.e., the last trading day before a media report was published speculating about a potential sale).
For us, the news was bitter-sweet since it provided a short-term bump to our portfolio performance but at the expense of what we believed to be significant long-term value. And since the deal is expected to close in the first quarter of 2020, we will need to redeploy the capital somewhere else when it does.
The largest detractor to performance was Simulations Plus (PLUS), which declined 16.11% during the quarter. As a reminder, Simulations Plus provides software and consulting services for use primarily in pharmaceutical and chemical research. During the fourth quarter, the company announced several funded collaborations with large pharmaceutical companies to add new features and improve their software. It also reported fourth quarter and full year results, which included revenue growth of 20.0% for the quarter and 14.5% for the full year as well as operating income growth of 2.6% for the quarter and 3.4% for the full year. Though operating margins were squeezed due to investments in sales and marketing, the investments appeared to begin bearing fruit as revenue growth accelerated for the third straight quarter.
However, we believe the underwhelming stock price performance during the quarter was more attributable to overvaluation and random stock price movements than any fundamental happenings at the company. For example, Simulations Plus at one point traded for nearly 90x trailing twelve months earnings, well above most reasonable intrinsic value estimates. As a result of this elevated valuation, we reduced our position in Simulations Plus during the fourth quarter but continued to maintain a small position due to the company’s strong management, competitive advantages, and favorable growth outlook.
On a side note, I had the privilege of meeting with Simulations Plus CEO, Shawn O’Conner, and President of the Lancaster division, John DiBella, at a pharmaceutical conference in San Antonio during the fourth quarter. I won’t bore you with the details, but overall, I walked away with a deeper understanding of the business, a continued belief in its potential, and the impression that Mr. O’Conner is generating a renewed sense of excitement around the company and its offerings. In fact, the highlight of the event for me (aside from the live armadillo races) was a sneak preview of the company’s latest software update “GastroPlus X”, which is scheduled to be released in April 2020. The update represents a major overhaul to previous versions and includes a more modern user interface. Though adoption of the new version is unlikely to be swift due to strong customer familiarity with previous versions, we think it has significant long-term potential. As a result, the thesis remains intact.
Our largest detractor to full year performance in 2018, Coherent Inc. (COHR), was our largest contributor in 2019, returning 57.47%. As a reminder, Coherent is a provider of laser-based technologies for a broad range of commercial, industrial, and scientific applications. Their lasers are used for applications such as DNA sequencing, vision correction, welding and cutting, and even hair and tattoo removal. However, the company’s largest market is the manufacturing and inspection of microelectronics, where they make the only high-energy lasers suitable for the production of OLED flat panel displays.
In the fourth quarter 2018 newsletter I wrote: “…the long-term prospects for OLED (and Coherent) are highly favorable. In the short-term however, the smartphone market is in the midst of a significant slowdown. As a result, smartphone makers such as Samsung and Apple have reduced their spending plans for capital equipment. Therefore, Coherent’s earnings are almost certain to decline in 2019. This prospect weighed heavily on the company’s stock price in the fourth quarter. However, based on our long-term views and our estimate of Coherent’s intrinsic value, we think the selloff is overdone. And what we originally saw as an attractive investment has become almost absurdly cheap. Nevertheless, we would not be surprised if the stock price declined even further as the market focuses on short-term headwinds in the smartphone market. But we feel strongly that our patience will pay off in the long-run as the industry recovers and OLED rapidly gains adoption.”
And in 2019 we began to see this happen. Although the company’s revenue declined by nearly 25% and adjusted operating earnings fell by almost 65% in 2019, our patience began to pay off as industry conditions improved. For instance, in July the company announced a system order it believed marked the beginning of the Phase 2 OLED buildout (which represents approximately one-third of the total buildout, or roughly $1.2B - $2.4B in market value). Then in September Apple introduced two more iPhone models with OLED displays – the iPhone 11 Pro and the iPhone 11 Pro Max. In November Coherent announced receipt of another order covering a new OLED fab. And in December, Digitimes reported that China’s BOE could begin to supply Apple – which is expected to launch three OLED-based iPhones in 2020 – with up to 45M OLED displays in 2021. As a result, the stock steadily recovered during 2019. But despite the increase, we think the stock remains attractive and the company’s long-term prospects are bright.
For the full year 2019, our largest detractor to performance was Care.com (CRCM), which declined 21.12%. This was largely the result of the Wall Street Journal article mentioned above and discussed in detail in the Kehlet Capital second quarter 2019 newsletter. Since the company is now in the process of being acquired, I will refrain from rehashing the analysis. However, for those who are interested, you can find the in-depth commentary in the second quarter 2019 newsletter at www.kehletcapital.com.
Portfolio Activity
During the fourth quarter we reduced our position in Simulations Plus, due entirely to valuation concerns as mentioned above, and used the cash to initiate a new position which I will describe in next quarter’s newsletter, once we have built a full position.
Conclusion
Fourth quarter results slightly underperformed but full year results were satisfactory. As we enter the new year the portfolio is undergoing some change, with the initiation of a new position and the likely need to initiate another soon. We are always on the lookout for great new ideas and will continue to work hard to position the portfolio for long-term success. As always, thank you for supporting Kehlet Capital Management, and please do not hesitate to contact us should you have any questions or comments.
Notes
- “U.S. International Trade in Goods and Services (FT900)”, U.S. Census Bureau, www.census.gov/foreign-trade/Press-Release/current_press_release/index.html#notseasonal ↩
- Oxford Economics, “Understanding the US-China Trade Relationship”, The US-China Business Council, www.uschina.org/sites/default/files/OE%20US%20Jobs%20and%20China%20Trade%20Report.pdf ↩
- Ravikumar, B. and Reinbold, Brian, “Is Value-Added Trade a Better Measure of Global Trade?”, Federal Reserve Bank of St. Louis, www.stlouisfed.org/on-the-economy/2019/april/value-added-trade-measure ↩
- Pham, Sherisse, “How much has the US lost from China’s IP theft?”, CNN Business, money.cnn.com/2018/03/23/technology/china-us-trump-tariffs-ip-theft/index.html ↩
- The World Bank, “List of countries by GDP (nominal)”, Wikipedia, en.wikipedia.org/wiki/List_of_countries_by_GDP_(nominal) ↩
- “Consumer Price Index”, St. Louis FRED, fred.stlouisfed.org/series/CPALTT01USM659N ↩
Disclosures to Performance Results
Actual composite performance results represent the performance of fully discretionary accounts managed by Kehlet Capital Management (KCM) during the corresponding time period. The composite performance results reflect time-weighted rates of return, the reinvestment of dividends and other account earnings. The reinvestment of dividends and other earnings may have a material impact on overall returns.
Past performance is not indicative of future results and the performance of a specific individual client account may vary substantially from the composite performance results. Therefore, no current or prospective client should assume that future performance will be profitable, or equal either the KCM composite performance results reflected above, or the performance results for any of the comparative index benchmarks provided.
For reasons including variances in portfolio account holdings, variances in the investment management fee incurred, market fluctuations, the date on which a client engages KCM’s investment management services, and any account contributions or withdrawals, the performance of a specific client’s account could vary substantially from the indicated KCM composite performance results. A portion of each account can be actively managed in an attempt to respond to changing conditions.
All performance results have been compiled solely by KCM, are unaudited, and have not been independently verified. Therefore, the performance data could be wrong. Information pertaining to KCM’s advisory operations, services, and fees is set forth in KCM’s current Form ADV Part 2A disclosure brochure, a copy of which is available from KCM upon request.
iShares IWM is an exchange-traded fund (ETF) measuring the performance of approximately 2,000 small-cap companies. It serves as a benchmark for small-cap stocks in the United States.
KCM managed accounts may own assets and follow investment strategies which cause them to differ materially from the composition and performance of the ETF shown as a benchmark. The ETF was chosen for its accessibility, transparency, independence, and relevance to KCM’s investment strategy, but there may be other indices that are more appropriate or applicable to the Concentrated Micro-cap Strategy. The historical index performance results are provided exclusively for comparison purposes only, so as to provide general comparative information to assist an individual client or prospective client in determining whether a specific Portfolio meets, or continues to meet, his/her investment objective(s). It should not be assumed that account holdings will correspond directly to any of the comparative indexes.
Different types of investments and/or investment strategies involve varying levels of risk, and there can be no assurance that any specific investment or investment strategy (including the investments purchased and/or investment strategies devised by KCM) will be either suitable or profitable for a client’s or prospective client’s portfolio and may result in a loss of principal. Accordingly, no client or prospective client should assume that the above portfolios (or any component thereof) serve as the receipt of, or a substitute for, personalized advice from KCM, or from any other investment professional.