
“When the time comes to buy, you won’t want to.”
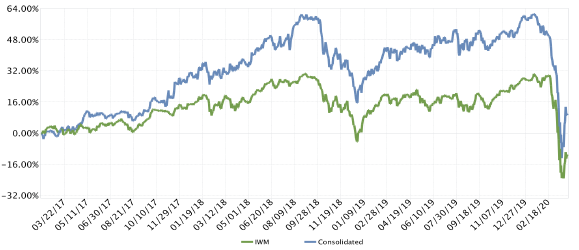
| Year | KCM Composite, Net | IWM | Excess Return |
|---|---|---|---|
| 2017* | 27.20% | 14.26% | +12.94% |
| 2018 | -3.43% | -11.11% | +7.68% |
| 2019 | 27.79% | 25.39% | +2.40% |
| YTD 2020 | -30.50% | -30.65% | +0.15% |
| Annualized | 2.79% | -3.85% | +6.64% |
*Inception date: 02/01/2017
Introduction
In the first quarter of 2020 markets were jolted by the economic disruption caused by the novel coronavirus, also known as COVID-19. We were not immune to the turmoil as the value of our portfolio fell, at one point, by over 40%. But while other investors were panicking, Kehlet Capital Management’s clients proved truly extraordinary. Not only did they remain calm amidst the chaos (e.g., there were zero redemptions), but some opportunistically added to their accounts. And while other Investment Managers were trying to soothe their client’s nerves, our investors allowed us to focus on the numerous opportunities that were presenting themselves in the market. As a result, we made several adjustments to the portfolio during the quarter (discussed in detail later) which give us a high degree of confidence in its long-term potential. For this reason, I would like to extend my sincere gratitude to all Kehlet Capital clients for their sensible and patient demeanor during this time. Not only does having great clients make my job more enjoyable but it likely provides the firm with a substantial competitive advantage.
That said, there has been a lot of debate lately about whether the economic shutdown was warranted or if it was a severe overreaction. So, what’s our take? Was the cure worse than the disease? We believe that answer depends heavily on one thing – the COVID-19 fatality rate (i.e., the number of deaths due to COVID-19 divided by the total population who contract the disease). Why? Because if the fatality rate is low – like 0.1% estimated for seasonal flu – the rate of infection is of little concern since most healthy people can be expected to survive. It is only when the fatality rate is sufficiently high – like 11% estimated for SARS – that the rate of infection needs to be controlled. Unfortunately, this critical piece of information is almost unknowable for a brand-new virus, especially one that spreads quickly and does not produce symptoms for five days or more. As a result, it can be helpful to turn to the experts during the early stages of an outbreak. And initially these experts estimated the fatality rate for COVID-19 to be approximately 1% (or roughly 10 times more deadly than the flu)1. At that rate, an estimated 1.6 million to 2.2 million Americans were expected to die and the healthcare system would be overwhelmed if the virus went unchecked.
But experts can be wrong (e.g., think weapons of mass destruction). So, it is often helpful to think about their incentives. For instance, health experts have incentive to scare people into compliance, the media has incentive to terrify people to drive ratings, politicians have incentive to appease a frightened constituency, business leaders have incentive to limit their liability, and pharmaceutical companies have incentive to profit by developing vaccines and therapies. It is important to highlight that the presence of these incentives does not mean the decisions of the “experts” were immoral or wrong. We simply note that most of them had incentives pointing in one direction – an overabundance of caution.
And though it’s helpful to think about incentives it can also be useful to question the expert’s assumptions. For example, to estimate the fatality rate of COVID-19, experts needed to make assumptions about the number of cases that were going undiagnosed. But given the potentially large number of asymptomatic or mild cases, and the tendency for modelers to err on the side of conservatism, we felt these assumptions would likely be too low. On the other hand, experts also had to assume the number of deaths due to coronavirus were being reported accurately. But based on the prevalence of underlying conditions in those who died, there was reason to believe COVID-19 deaths would be overcounted. In other words, it seemed likely that people who died from an underlying condition but also tested positive for coronavirus would be counted as a death due to coronavirus. Though some may argue that the potential overstatement of COVID-19 deaths is unlikely to move the needle, we would point out that, in a normal year, approximately 50,000 people in the U.S. die per month from heart disease and another 50,000 from cancer2. If even a small portion of these people were reported as a COVID-19 death, it could meaningfully skew the fatality rate. And as White House task force member Dr. Deborah Birx said recently “… the intent right now is that if someone dies with COVID-19 we are counting that as a COVID-19 death.”
Based on these factors, it appears likely that the true fatality rate is much lower than initially projected. And the more data that comes in, the clearer this picture becomes. In fact, more recent estimates place the fatality rate at around 0.66%3 (still much more deadly than the flu). But we are optimistic this number will fall even further as we gather more data, increase testing capacity, continue our mitigation efforts, and develop new therapies and vaccines. This may already be happening as the projected number of deaths in the U.S. has fallen on a consistent basis4.
We certainly don’t fault anyone for exercising an abundance of caution in the face of uncertainty. And even if hindsight suggests that shutting down the economy for a few weeks was unnecessary, we think it was a prudent move to try and protect hundreds of thousands, if not millions of lives. But the longer the economy remains closed, and the more the COVID-19 fatality rate falls, the more the cost-benefit analysis shifts the other way. Therefore, we think the best path forward is to reopen the economy gradually as soon as the death rate falls to an appropriate level and the healthcare system is adequately prepared (i.e., has enough beds, ventilators, PPE, medicine, etc.). We think this scenario involves allowing the low-risk population (i.e., young, healthy people and anyone with antibodies) to go back to work while still maintaining social distancing, work from home arrangements, and other mitigation efforts like hand washing and wearing masks. And we’re hopeful that this can take place by early to mid-May. If so, we think the economy will rebound sharply, stocks will recover and those most at risk of COVID-19 will be protected. But there is always the potential that we could be wrong. And as I said, you should always question the experts.
Performance
During the first quarter of 2020, Kehlet Capital Management’s concentrated micro-cap composite fell 30.50%, roughly in line with the benchmark which declined 30.65%.
The largest contribution to performance came from Bandwidth Inc. (BAND), which returned 6.64% during the quarter. As a reminder, Bandwidth is a Communications Platform as a Service, or CPaaS, company that provides large enterprises with application programming interfaces (API’s). These API’s enable software developers to add communications features – such as voice calling and text messaging – into their own applications without the need to build backend infrastructure and interfaces. The company’s solutions power many of the largest web conferencing applications including Zoom, Google Voice, Skype for Business (now Microsoft Teams), RingCentral, and Cisco-Webex.
In the first quarter 2019 newsletter, I outlined our investment thesis for Bandwidth which was based, in part, on significant long-term tailwinds in the CPaaS industry. These tailwinds have primarily been driven by the increasing number of companies embarking on a digital transformation in order to better engage with their customers and empower their increasingly mobile workforce. Needless to say, this trend accelerated exponentially in the first quarter as the coronavirus outbreak forced companies to encourage (or even require) employees to work remotely. At the same time, travel restrictions and stay-at-home orders drastically limited the ability to conduct business face-to-face and therefore enhanced the value of conferencing and communications applications powered by Bandwidth. As a result, the company’s stock price was able to avoid the precipitous declines experienced by almost every other stock in the market. And since Bandwidth operates a usage-based model, where it gets paid on a per minute and per text message basis, we expect the company to report excellent financial results over the next couple of quarters. How long these improved tailwinds will last is anyone’s guess, but we like Bandwidth’s long-term prospects and believe it is well positioned to continue to benefit from favorable trends in the communications software market.
The largest detractor to performance was Callaway Golf (ELY), which declined 50.75% during the quarter. As a reminder, Callaway is a designer and manufacturer of golf equipment with one of the strongest brands in the industry. In past newsletters I have talked about the various events impacting the business and our evaluation of the company’s long-term prospects. And our views remain largely unchanged. But like virtually every other company in the U.S., Callaway was significantly impacted by the economic shutdown in the first quarter due to the novel coronavirus. We believe the company’s stock price was hit particularly hard due to a) Callaway’s products being largely discretionary in nature and therefore more likely to experience a sharp decline in sales, and b) concerns over the company’s ability to meet its financial obligations given the pending decline in demand, Callaway’s working capital needs, and the level of debt it carries on the balance sheet. However, we believe that a) any sales decline due to the coronavirus will almost certainly be temporary and should therefore be of minimal concern to long-term investors, and b) concerns over liquidity are severely overblown due to 1) the company’s available liquidity (i.e., cash on hand plus unused borrowing capacity) relative to its estimated working capital needs, 2) Callaway’s ability to access additional capital if necessary through new debt facilities, fiscal stimulus, or debt restructuring, and 3) its efforts to conserve cash through cost cutting initiatives. As a result, we felt the company’s stock became absurdly cheap and added meaningfully to our position in the first quarter. It now represents the largest position in the portfolio at just over 15%. And we believe the investment thesis is as attractive as ever.
Portfolio Activity
During the first quarter our position in Care.com (CRCM) was closed out due to the completion of its acquisition by InterActiveCorp (IAC). During the three years we owned Care.com it provided an annualized return of approximately 36.8% compared to an annualized return of about 8.5% for the benchmark. Although this is a highly satisfactory outcome, we felt strongly that the stock had further to run had it remained a stand-alone public company. However, our dismay in missing out on the remaining portion of this opportunity was more than offset by our delight from two other circumstances. First, the timing of Care.com’s sale proved highly fortuitous since it occurred less than two weeks prior to the market crash. As a result, our large cash position at the time (about 14% - 15% of the portfolio) had the dual benefit of helping to cushion the impact of falling stock prices in other areas of the portfolio as well as providing the ability to initiate or increase positions at highly attractive prices. And second, we had the good fortune of recently stumbling upon two new investment opportunities that we feel very strongly about (one of which we will detail below). It’s important to emphasize that, given our investment process which filters thousands of companies down to only a handful of potential investments, finding one satisfactory new idea per year can be difficult. Finding two in a short period of time makes us downright giddy.
We also closed out our position in NRC Health (NRC) during the quarter, due primarily to valuation concerns and to free up capital for what we believed were more attractive investment opportunities. During the nearly three years that we owned NRC it provided an annualized return of approximately 30.5% compared to an annualized decline of about 6.3% for the benchmark.
We partially redeployed this capital into a company called Fonar Corp. (FONR). We began acquiring shares during the fourth quarter of 2019 and used the market downturn in March to build a full position. Some background on the company is warranted. Fonar is a provider of MRI diagnostic imaging services in 26 locations throughout New York and Florida. But what makes the company unique among imaging centers is that it also manufactures the only open and upright MRI capable of scanning patients in the weight-bearing position (i.e., standing or sitting up). Not only is this ideal for patients with claustrophobia, but more importantly, it is significantly better than traditional, recumbent-only (i.e., lay down) scanners at detecting problems in the spine, neck and back. And this differentiation provides Fonar with both a consistent flow of patients and an attractive payor mix. For example, because a large portion of back injuries occur on the job or due to car accidents, Fonar’s patients tend to be covered by Workers Compensation and Personal Injury Protection (also known as “no-fault” car insurance). And these payors offer some of the highest reimbursement rates in the insurance industry due to their smaller scale and lower negotiating leverage compared to other commercial payors. In fact, these two payors account for over 65% of Fonar’s revenue (compared to just 4% for the lowest payors in the industry, Medicare and Medicaid). As a result, the company generates profit margins that are almost unheard of in the diagnostic imaging space.
And while we feel this level of differentiation, combined with an attractive stock price, helps limit the downside of the investment, what we really like is the potential upside. In fact, we believe the company is severely misunderstood due to exaggerated concerns over falling reimbursement rates. For instance, on November 9, 2017 Fonar reported its 2nd quarter 2017 results, which saw revenue growth slow to 3%. In the press release Chairman Raymond Damadian stated, “given that reimbursement rates for independent MRI providers continue to fall year after year, (Fonar’s) performance is truly remarkable.” The comments seemed to spook the market and the company’s stock price fell 31% within a few days and has trended downward ever since. Then in April 2019, an article on Seeking Alpha identified reimbursement rates as a “major risk.” In fact, Fonar’s own annual 10-K report mentions multiple proposals in New York and Florida since 2014 attempting to reduce no-fault insurance reimbursement rates. So, there is clearly cause for concern, right? Perhaps. But our research indicates that these fears are overblown for two reasons: 1) While there has certainly been pressure on reimbursement rates over the years, the company has more than offset these pressures with increases in patient volume. And we think this is likely to continue due to long-term trends in healthcare and the company’s ability to convey a unique value proposition to physicians and patients. And 2) we believe Fonar is positioned for significant growth in 2021 due to a couple of factors. First, the company recently announced plans to expand capacity by adding three new MRI scanners by the end of June. Although this effort will almost certainly be delayed a few months due to the coronavirus, we believe it bodes well for future revenue since it is the first major organic expansion initiative undergone by the company in several years and increases Fonar’s potential scan volume by approximately 8.5%. And second, reimbursement rates are scheduled to increase substantially starting in October. How do we know? Because we purchased the soon-to-be-implemented Workers Compensation and No-Fault Insurance medical fee schedules from the State of New York and discovered that reimbursement rates are scheduled to increase by 10% - 15% for nearly every radiology service including MRI. So, when we combine these scheduled increases with the potential growth in patient volume due to capacity expansion, it seems clear that Fonar can easily achieve 15% - 20% topline growth in 2021, with potentially higher growth in profitability.
By itself, we think this unique understanding of Fonar’s business gives us an edge and provides an attractive investment opportunity. But when you add that knowledge to a stock that also appears ridiculously cheap, you get a risk/return trade-off that is rarely found. For example, as of March 31st, 2020, Fonar traded at just over 7x trailing twelve month earnings (ex-cash), had a price to tangible book value of slightly below 1x, carried virtually no debt and had over $30M in cash and cash equivalents on the balance sheet. For the non-technical reader trying to interpret those numbers, let me just say that they are somewhat mind-boggling. Simply put, they represent a value the market typically assigns to dying businesses in long-term decline, not companies with competitive advantages in growth industries. Now, we understand that these numbers will be impacted by the recent coronavirus outbreak. But even factoring that in, we think the stock would prove attractive for a company with no growth prospects, let alone one that is likely to grow nearly 20% next year. Again, we believe this pessimistic view is a result of the markets misunderstanding of future reimbursement rates and an overreaction to the economic consequences of the coronavirus. Time will tell if our thesis proves correct, but we believe we have a deep understanding of the business and feel very good about the risk/reward tradeoff Fonar represents.
Finally, we initiated two more positions in the first quarter of 2020, both of which we will outline next quarter assuming we have built full positions. We also made a few adjustments to portfolio weights, given the numerous opportunities that presented themselves. Namely we reduced our position in Coherent Inc. (COHR) and added to our positions in Callaway Golf (ELY) and Astronics Inc. (ATRO).
Conclusion
The first quarter was a volatile one and unnerving in many respects. But our portfolio weathered the storm reasonably well. Thanks in large part to our patient, long-term focused clients we were able to capitalize on numerous opportunities during the quarter and position the portfolio for the years to come. As a result, we think our goal of providing clients with highly satisfactory long-term results across all market environments is as achievable as ever. As always, thank you for supporting Kehlet Capital Management, and please do not hesitate to contact us should you have any questions or comments.
| Number of holdings | 11 |
|---|---|
| Median market cap | $513M |
| Weighted avg. market cap | $813M |
| Callaway Golf Co. (ELY) | 15.3% |
|---|---|
| Bandwidth Inc. (BAND) | 13.1% |
| Fonar Corp. (FONR) | 12.4% |
Notes
- Wighton, Kate and Dr. van Elsland, Sabine, “Coronavirus Fatality Rate Estimated by Imperial Scientists”, Imperial College London, imperial.ac.uk/news/195217/coronavirus-fatality-rate-estimated-imperial-scientists/ ↩
- “National Center for Health Statistics Deaths and Mortality”, Center for Disease Control and Prevention, cdc.gov/nchs/fastats/deaths.htm ↩
- Gallagher, Laura, “COVID-19: One in Five over-80s Need Hospitalisation and Death Rate 0.66 Percent”, Imperial College London, imperial.ac.uk/news/196573/covid-19-one-five-over-80s-need-hospitalisation/ ↩
- Hoonhout, Tobias, “IHME Model Revised Again, Cutting Coronavirus Death Projection by Over 35 Percent”, National Review, nationalreview.com/news/ihme-model-revised-again-cutting-coronavirus-death-projection-by-over-35-percent-in-days/ ↩
Disclosures to Performance Results
Actual composite performance results represent the performance of fully discretionary accounts managed by Kehlet Capital Management (KCM) during the corresponding time period. The composite performance results reflect time-weighted rates of return, the reinvestment of dividends and other account earnings. The reinvestment of dividends and other earnings may have a material impact on overall returns.
Past performance is not indicative of future results and the performance of a specific individual client account may vary substantially from the composite performance results. Therefore, no current or prospective client should assume that future performance will be profitable, or equal either the KCM composite performance results reflected above, or the performance results for any of the comparative index benchmarks provided.
For reasons including variances in portfolio account holdings, variances in the investment management fee incurred, market fluctuations, the date on which a client engages KCM’s investment management services, and any account contributions or withdrawals, the performance of a specific client’s account could vary substantially from the indicated KCM composite performance results. A portion of each account can be actively managed in an attempt to respond to changing conditions.
All performance results have been compiled solely by KCM, are unaudited, and have not been independently verified. Therefore, the performance data could be wrong. Information pertaining to KCM’s advisory operations, services, and fees is set forth in KCM’s current Form ADV Part 2A disclosure brochure, a copy of which is available from KCM upon request.
iShares IWM is an exchange-traded fund (ETF) measuring the performance of approximately 2,000 small-cap companies. It serves as a benchmark for small-cap stocks in the United States.
KCM managed accounts may own assets and follow investment strategies which cause them to differ materially from the composition and performance of the ETF shown as a benchmark. The ETF was chosen for its accessibility, transparency, independence, and relevance to KCM’s investment strategy, but there may be other indices that are more appropriate or applicable to the Concentrated Micro-cap Strategy. The historical index performance results are provided exclusively for comparison purposes only, so as to provide general comparative information to assist an individual client or prospective client in determining whether a specific Portfolio meets, or continues to meet, his/her investment objective(s). It should not be assumed that account holdings will correspond directly to any of the comparative indexes.
Different types of investments and/or investment strategies involve varying levels of risk, and there can be no assurance that any specific investment or investment strategy (including the investments purchased and/or investment strategies devised by KCM) will be either suitable or profitable for a client’s or prospective client’s portfolio and may result in a loss of principal. Accordingly, no client or prospective client should assume that the above portfolios (or any component thereof) serve as the receipt of, or a substitute for, personalized advice from KCM, or from any other investment professional.