
“A wise man changes his mind; a fool never will.”
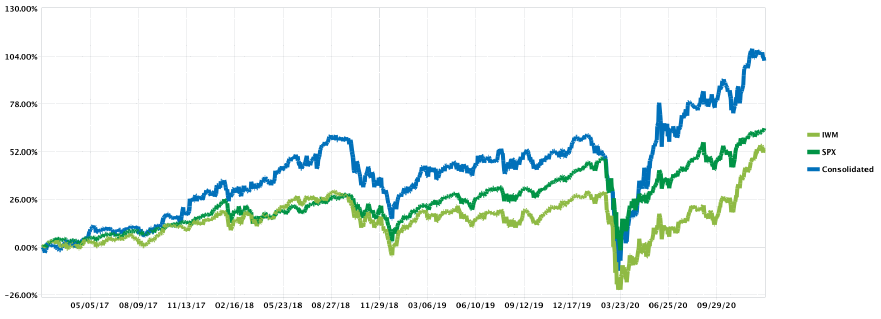
| Year | KCM Composite, Net | IWM | Excess Return |
|---|---|---|---|
| 2017* | 27.20% | 14.26% | +12.94% |
| 2018 | -3.43% | -11.11% | +7.68% |
| 2019 | 27.79% | 25.39% | +2.40% |
| 2020 | 27.52% | 20.03% | +7.49% |
| Annualized | 19.39% | 11.45% | +7.94% |
*Inception date: 02/01/2017
Modification from Last Quarter
Before I get to the topic of this newsletter, I want to make a modification to last quarter’s letter on Bitcoin. Simply put, I now believe my original conclusion – that Bitcoin has no value and is therefore a failed experiment – is wrong. So why the sudden change of heart? Because as I continued to research the topic, I realized a few things. First, anything can have value if people agree that it does. In fact, money has taken many different forms throughout history; from stones, to cattle, to gold, to today’s fiat currencies. Therefore, even digital assets can have value. For example, domain names such as business.com, lasvegas.com, and carinsurance.com have sold for tens of millions, even hundreds of millions of dollars. Back in the early days of the internet this probably seemed crazy to most people – just like buying Bitcoin seems today. But it no longer appears so ridiculous. After all, there is only one tesla.com. If someone other than Tesla owned that domain name, shouldn’t the company be willing to spend a few million dollars to acquire it? Which brings me to the next realization that scarcity is the key to maintaining value. Take fiat currencies for instance. Because Central Banks around the globe can (and do) print new money to stimulate the economy, the value of fiat currencies declines over time, resulting in inflation. That is, the less scarce a U.S. dollar becomes the more its value falls. This is precisely why many investors have turned to gold as a place to store excess cash. Because the supply of gold only tends to grow at about 1% - 2% per year, while global GDP grows closer to 3% annually. This dynamic increases gold’s scarcity, and thus its value, over time. Not surprisingly, gold has historically done a much better job of storing value than the U.S. dollar. For example, over the last 30 years, the price for an ounce of gold has grown at an average of roughly 5% annually, while the value of the U.S. dollar has fallen at more than 2% annually. However, Bitcoin is an even better store of value than gold. Why? 1) Because Bitcoin’s supply growth will gradually drop to zero by the year 2140, thus ensuring its scarcity, whereas gold’s supply will likely continue to grow. And 2) Bitcoin is significantly easier to transport and transact with since it is entirely digital. Therefore, Bitcoin should continue to take market share from gold for the foreseeable future.
But Warren Buffett has long emphasized that gold is a non-productive asset, and therefore equities should be a better long-term investment. I tend to agree. So why should Bitcoin be any different? Because it is still extremely early in the cryptocurrency’s adoption curve. To put it in perspective, at the time of this writing, the total value of all bitcoins in existence is currently around $650 billion. Whereas the value of all the gold in the world is estimated to be roughly $10 trillion – or over 15 times more than Bitcoin.
The real question is, how much is a bitcoin worth? While there are a number of interesting valuation methods available including the stock-to-flow model and the quantity theory of money, I prefer a simpler method. Let’s just say Bitcoin were to replace 50% of the $10 trillion gold market over the next ten years. That would take the price of a single bitcoin from about $35,000 today to approximately $240,000 in 2031. If we discount this back to today assuming a discount rate of 7%, it puts the value of a single bitcoin at just over $120,000. It should also be noted that this price does not contemplate Bitcoin becoming a medium of exchange for the $80 trillion global economy, which would likely take the price exponentially higher. Although that scenario seems unlikely in the short-term (< 10 years), it is much more probable over the long-term (15 – 30 years) as Bitcoin gains acceptance and reaches maturity as a store of value. But given the uncertainty surrounding this outcome, it is probably best thought of as a call-option.
That is not to say Bitcoin doesn’t come without its fair share of risks – the most notable being potential government intervention to maintain control over the money supply. But there are good arguments to be made for why those risks are unlikely to come to fruition. Therefore, Bitcoin’s future looks bright. In the long-run I still believe equities are the superior investment. But in the short-run Bitcoin is likely to outperform. Unfortunately, Kehlet Capital Management cannot invest directly in Bitcoin. But we can invest indirectly – by owning businesses that are tied to its success. At present, there are very few in the micro-cap space that I am aware of. But I suspect that, as Bitcoin becomes more entrenched and people come to realize its value, more and more companies will hold Bitcoin on their balance sheets in lieu of cash. Until then, I will continue to keep my eyes peeled for new opportunities. Now, on to the newsletter.
Introduction
I think most people would agree that the healthcare system in the United States is broken. Consider the fact that an estimated 200,000 Americans die each year due to medical errors such as hospital-borne infections, preventable blood clots, and prescription errors.1 Or that the share of GDP devoted to healthcare has grown from 5.8% in 1965 to 17.7% today. Or that nearly 1 in 5 Americans has medical debt in collections.2 In fact, most of us probably have a health care horror story involving long wait times, inexplicable bills, disorganization, lack of follow-up, and even sheer incompetence. So, what’s wrong with the healthcare system and how can it be fixed?
First, I understand that it might come across as tone deaf to criticize the healthcare industry amid a pandemic. But my dismay with healthcare is not with the people on the frontlines. They are real life heroes. Rather, my criticism is directed at the way the healthcare system is structured and the perverse incentives it creates. And it’s a system that depends on third party payors like Medicare, Medicaid, and private insurance to cover virtually all of our medical costs. I’m not saying we shouldn’t use insurance for expensive, unpredictable emergencies or chronic conditions. In those situations, insurance pools risk efficiently as it should. I’m questioning why we also use it for routine, predictable care like basic check-ups, planned pregnancies, elective surgeries, and prescription drugs. Think about it. You probably don’t use your auto insurance policy to pay for a tune-up or your homeowner’s policy to pay for a paint job? So why do we do that with health care? My suspicion is it’s because we all like the idea of someone else paying our expenses. But ultimately, they aren’t. Because in the long run we all end up bearing the cost through higher premiums, lower wages, and taxes to Medicare and Medicaid.
And though our dependence on intermediaries may seem harmless, it creates enormous waste and excess cost due to moral hazard. In other words, people are more likely to make or inflate claims and tolerate higher costs when insurance is involved. Consider the problem of overtreatment. A detailed report by 21 physicians in Washington State found that 45% of health care services in the state were unnecessary. In total, they found that 600,000 patients in Washington underwent medical services they didn’t need, costing an estimated $282 million in one year (and in just one state). But cost isn’t the only issue. Overtreatment can also lead to higher health risks. Consider the antibiotic resistance problem, the opioid crisis, or the anti-microbial resistance crisis. All are side effects of overtreatment that is enabled by moral hazard. Another example is the excessive administration costs involved with approvals and denials, which is estimated to cost $1,000 a year per American household. In other words, insurance companies and hospitals employ armies of people to manage claims and approve or deny care. And these people cost money, which is ultimately paid for by our premiums. But these hidden costs are largely tolerated because of moral hazard. But what if we oversaw our own approvals and denials? What if we paid for our health care directly? Odds are we would all be empowered to decide what we were willing to pay for and what we were not at virtually no administrative cost.
We have entrusted third parties with controlling excess care, negotiating lower prices, and driving safety and quality on our behalf. And they are supposed to have our best interests at heart. But the last fifty years suggests otherwise. Why? Because, as author David Goldhill puts it in his book Catastrophic Care:
“intermediaries may have some incentive to push for lower costs, less waste, and higher quality, but these incentives are actually quite minor and are often in direct conflict with (their) broader goals… True an insurers profitability in any given year depends on its ability to keep reimbursements for care below the amount charged in premiums. But over time, its incentive is the exact opposite: to see spending on health care increase as much as possible. Why? Like with any private business, insurers require consistent and profitable growth to satisfy their shareholders. And you can’t really achieve profit growth by reducing payouts for care – any cost improvements will almost certainly translate to lower premiums. So the only way for the health industry to increase profits is to increase premiums. And there’s only three ways to increase this rate base – customers must get sicker, policies must expand to cover new types of care, or prices for care must rise (i.e., the cost of claims must rise).”
Simply put, the major incentives of insurance companies are in direct conflict with our own. So, if Medicare, Medicaid and private insurance is not the answer, where do we go from here? Again, I’ll refer to author David Goldhill:
“we need to recognize that our health care system won’t function properly – indeed, will continue to be dangerously undisciplined – unless it is accountable to actual consumers. And the only way to increase consumers’ role is to shift much of the enormous resources now passing through insurance and government programs back to us. We will need to confine insurance to what it does efficiently (protect us against catastrophe) and remove it from what it does disastrously (serve as the payment system for all care). Only then will we align health care incentives with our interests.”
Unfortunately, this is easier said than done due to a couple major barriers. First is a lack of price transparency. Have you ever tried comparing prices for similar medical procedures? It’s nearly impossible. For example, in a study by the University of Iowa, researchers called 101 U.S. hospitals and asked what they would charge for a heart bypass operation. Almost half – 48 of them – would not provide a price. But how can we as consumers drive prices lower if we can’t comparison shop? The second issue is a lack of health savings. That is, we can’t immediately transition to a consumer-driven healthcare system if it means that millions of Americans will suddenly be unable to afford their health care. They need time to build up the appropriate savings.
The good news is that the healthcare system is moving in the right direction. For instance, the George W. Bush administration began the process of shifting healthcare to a consumer-driven model through the implementation of high-deductible health plans which come with a tax-advantaged health savings account (HSA). This allows consumers to develop health savings over time and take greater control of their health decisions. And these plans have been gaining rapid adoption. Obamacare also put us on the path toward better alignment of incentives. That is, it started the process of moving from a fee-for-service model, where physicians are reimbursed based on the number of services performed, to a value-based care model, where reimbursement is based on the quality of care and successful health outcomes. One can argue that the way quality is currently being measured – patient satisfaction and readmission rates – is flawed, but at least it is a step in the right direction. Additionally, President Trump has made progress at increasing price transparency in the industry by forcing hospitals to disclose the rates they privately negotiate with insurers. As a result, I am optimistic about the future of health care. Its overhaul will likely take multiple decades to achieve, but when it does the result is likely to be greater access to world-class health care at an affordable price. I for one look forward to that day.
Performance
During the fourth quarter of 2020, Kehlet Capital Management’s concentrated micro-cap composite increased 12.01%, significantly underperforming the benchmark which grew 31.30%. However, for the full year 2020, the Kehlet Capital Management concentrated micro-cap composite increased 27.52%, outperforming the benchmark, which grew 20.03%.
Our largest detractor last quarter, Astronics Corp. (ATRO), was our best performer in the fourth quarter, returning 71.45%. In last quarter’s newsletter, I noted my confidence in Astronics’ long-term prospects due to the temporary nature of the 737 MAX grounding and the outbreak of COVID-19. And during the quarter one of those two issues resolved itself – the grounding of the 737 MAX. On November 18th, 2020, the FAA announced that the aircraft had been cleared to return to service in the U.S. and on December 29th, American Airlines resumed commercial operations. Shortly thereafter United Airlines, Southwest Airlines, and Alaska Airlines all announced plans to return the 737 MAX to service in early 2021. This is unquestionably good news for Astronics, which provides roughly $95,000 of content on each 737 MAX aircraft. In fact, prior to its grounding, the plane was generating approximately $48 million in annual revenue for the company. However, this positive tailwind is still more than offset by the current headwinds caused by COVID-19. And while the increased stock price during the fourth quarter was largely driven by the news of the 737 MAX, the big returns are likely to come when we finally move past the COVID-19 crisis. Therefore, I believe the company still has significant potential and the thesis remains intact.
For the full year 2020, the largest contribution to performance came from Bandwidth Inc. (BAND), which returned 149.16%. Last quarter, I noted the huge surge in stock price that had occurred in 2020 – it was our best performer three quarters in a row – and how I had taken some of our position off the table due to valuation concerns. However, shortly after I sold down our position three things happened. First, the company reported third quarter results well above even my lofty expectations. Second, Bandwidth announced an acquisition, which accelerated their international expansion and provided potential for future growth. And third, the stock price fell by roughly 27% from its peak. As a result of these three factors, the valuation became considerably more attractive and I added to our position in the fourth quarter. It is now our fourth largest position.
For the fourth quarter, the largest detractor to performance was Fonar Corp. (FONR), which declined 16.52% during the quarter. As a reminder, Fonar is a provider of MRI diagnostic imaging services in 26 locations throughout New York and Florida. What makes the company unique among imaging centers is that it also manufactures the only open and upright MRI capable of scanning patients in the weight-bearing position (i.e., standing or sitting up). Not only is this ideal for patients with claustrophobia, but more importantly, it is significantly better than traditional, recumbent-only (i.e., lay down) scanners at detecting problems in the spine, neck and back. In the first quarter of 2020, I noted my thesis that FONAR was significantly undervalued and poised to grow substantially in 2021 due to scheduled increases in reimbursement rates as well as recently added scanning capacity. And very little has changed since then. In the fourth quarter, the company reported its fiscal Q1 results, which were highlighted by a decline in revenue of 3.5%, a drop in scan volumes of 13%, and a decrease in operating income of 24%. However, included in expenses was a $2.2 million reserve against management contracts due to business interruptions from COVID-19. Excluding these costs, operating income would have grown nearly 16% year-over-year. The company also completed the installation of two more scanners during the quarter (in Pembroke Pines, FL and Islandia, NY) and expects to install two more during Fiscal 2021 (in Westchester County and Bronx County, NY). And with the recent increase in no-fault reimbursement rates in New York which took effect in October, I believe next quarters financial results will show even further improvement in revenue and profitability. Therefore, my conviction on this position remains high and it is currently our second largest in the portfolio.
For the full year 2020, the largest detractor to performance was DXP Enterprises (DXPE), which declined 45.06%. As a reminder, DXP is an industrial distributor of maintenance, repair, and operations (MRO) products used in oil & gas production as well as general manufacturing. It operates more than 175 locations in thirty-four U.S. states and nine provinces in Canada, while serving more than 50,000 customers. The original thesis on DXP was that, despite the cyclicality of the oil and gas industry, the company’s business model was resilient, and end-markets would recover from their lows in 2016. Then COVID-19 hit, oil prices plummeted, and I realized just how dependent the company was on commodity prices. At Kehlet Capital, I intentionally try to avoid businesses with commoditized products or significant exposure to commodities themselves – they tend to be low margin, low return on investment companies. But in DXP’s case, I believed that their high-touch distribution model, technical expertise, and acquisition strategy would continue to create long-term value for shareholders. That may still be the case, but it is highly dependent on the return of oil prices to some reasonable level. And I simply can’t predict if or when that will happen. Therefore, I decided to move on and closed out the position during the fourth quarter. During the 2.5 years we owned the stock it averaged an annualized return of -11.3% compared to an annualized return of 6.0% for the benchmark. This is obviously a subpar outcome. Needless to say, I will try to avoid making the same mistake twice.
Portfolio Activity
During the fourth quarter I also closed our positions in Simulations Plus (SLP) and Coherent Inc. (COHR). During the three years we owned Simulations Plus it provided an annualized return of approximately 57.6% compared to an annualized return of about 4.6% for the benchmark. In the fourth quarter 2019 newsletter I mentioned that I had reduced our position in the company due to concerns about valuation. And the stock has doubled since then. Although the business has continued to do well amid the COVID-19 pandemic, my concerns regarding valuation increased last quarter when the company traded at roughly 117x trailing twelve-month (TTM) earnings and 34x TTM revenue. This would likely be excessive for a high growth business with room to expand margins. But for one with moderate growth and nearly 30% operating margins, it is just plain silly. I simply could not justify the assumptions needed to make the valuation work anymore. Therefore, I closed out the small position we had remaining.
During the 2.5 years we owned Coherent Inc. it provided an annualized return of -15.2% compared to an annualized return of 5.7% for the benchmark. This is clearly another poor result. In hindsight, I believe I made a number of mistakes with this name. First and foremost, I never should have bought the stock to begin with because it was simply too large. At nearly $3 billion in market capitalization, Coherent was above my self-imposed limit of $1 billion on newly initiated positions. When I bought the stock, the fund was still relatively new, I was short on good investment ideas, and Coherent seemed too good to pass up. I debated whether or not to include the company in the portfolio and ultimately decided to move forward. At the time, I thought making money for clients was all that mattered. But so is doing what you say you are going to do. Therefore, this outcome could have been avoided if I had not been so eager. Second, I should have challenged my investment thesis more. My rational for Coherent was that the underwhelming sales of Apple’s iPhone X were overblown, that OLED would continue to gain adoption, and capital investment in laser systems such as Coherent’s would remain robust. But the industry downturn turned out to be even worse than I or the market expected, and the stock price continued to drop. Evidently the information I needed to make a better decision was available – the market already knew it – I just didn’t find it. While I will do my best to ensure this doesn’t happen again, the truth is it almost certainly will. Because you never know what you don’t know. And sometimes no amount of due diligence will discover that critical missing piece of information. Future mistakes will hopefully be mitigated by the margin of safety I build into every stock purchase, but I can make no guarantees. And thirdly, my overconfidence caused me to take a larger initial stake – about 15% – than I should have, and it cost us. Because when the price plummeted, I was hesitant to add to the position since it was already so large. Although the holding may still have underperformed in total, adding shares near the bottom would have made a bad outcome slightly more palatable. As a result, my philosophy since then has been to start with a small position and add to it opportunistically over time as I become more comfortable with it.
I partially redeployed the capital produced by the sales of Simulations Plus and Coherent toward building a new position in Wayside Technologies (WSTG). Wayside is an information technology (IT) software distributor of new and emerging technologies. The company specializes in cloud-based and data center software and occupies a unique niche in the IT distribution space. That is, they are one of a few independent distributors focused on providing new and emerging software, rather than mature, well-established offerings. And this focus creates a narrow moat around the business. For example, most of the company’s larger competitors sell well-known products from vendors like Microsoft, Cisco, Dell, and HP. But those products tend to require very little sales effort since the brands are already so well known. But Wayside sells products from new and emerging software vendors with less recognizable names like Illumio, Trend Micro, and Zendesk. And these products need to be sold. But the salesforces of large distributors have little incentive to sell high-effort, low volume new products from unknown brands when they can sell low-effort, high-volume products from household names. And it’s this emphasis on new and emerging technology, along with roughly 4,000 long-standing relationships with value-added resellers (VARs), that provides Wayside with a competitive advantage.
The company also brought in a new management team two years ago, who quickly returned the business to growth. In the two phone conversations I have had with CEO Dale Foster, he strikes me as an honest, highly capable, and motivated leader. In fact, prior to joining Wayside, he was the CEO of ProMark (a software distribution competitor of Wayside’s) where he took the business from $26 million in sales in the early 2000’s to $150 million in 2012. It was then sold to another competitor, Ingram Micro, and Dale stayed on for five more years – eventually growing it to $580 million in sales. And now that he oversees Wayside, I am confident this will be his encore performance. He has already made significant progress. For instance, after joining Wayside, Dale immediately revamped the salesforce, removed underperforming “lifestyle” employees, restructured compensation to better align incentives, and brought in a vendor recruitment team to rationalize partnerships and bring on new, high-growth vendors. And the early results look promising.
Third, at under 7x TTM earnings, net of cash, the valuation appears highly attractive and provides a large margin of safety. Even excluding the excess cash from the balance sheet, the company still trades at just over 13x TTM earnings. At today’s interest rates, that multiple would be roughly fair value for a no-growth business. But Wayside is growing. In fact, revenue grew 16% last quarter and, as the company continues to take share in an expanding $200 billion IT industry, I expect it will grow at attractive rates for the foreseeable future.
I also initiated another new position in the fourth quarter which I will outline next quarter assuming I have built a full position. Finally, a few adjustments were made to portfolio weights, given the continued volatility in the market. Namely I reduced our positions in LeMaitre Vascular (LMAT) and Hibbett Sports (HIBB) and added to our positions in Callaway Golf (ELY) and Bandwidth Inc. (BAND).
Conclusion
The fourth quarter was unusual in that the goalpost set by the benchmark was remarkably high. Although our results were satisfactory on an absolute basis, they were disappointing relative to the index. I can only speculate as to what caused such a large discrepancy, but my guess is that U.S. small-cap equities moved rapidly toward bubble territory as Central Banks printed more money. I say that in part because I have been noticing an increasing number of individual stocks that have grown to bubble-like valuations. And whenever bubbles are forming, our strategy of investing in high quality, reasonably priced businesses is likely to underperform. Though I can’t say for certain that is what happened last quarter, it sure felt like it. The good news is that bubbles do not continue forever. And though I cannot predict the timing of a correction, our strategy should do well if/when it happens. As always, thank you for supporting Kehlet Capital Management, and please do not hesitate to contact me should you have any questions or comments.
| Number of holdings | 10 |
|---|---|
| Median market cap | $775M |
| Weighted avg. market cap | $1,562M |
| Callaway Golf Co. (ELY) | 15.9% |
|---|---|
| Fonar Corp. (FONR) | 13.4% |
| Astronics Corp. (ATRO) | 11.5% |
Notes
Disclosures to Performance Results
Actual composite performance results represent the performance of fully discretionary accounts managed by Kehlet Capital Management (KCM) during the corresponding time period. The composite performance results reflect time-weighted rates of return, the reinvestment of dividends and other account earnings. The reinvestment of dividends and other earnings may have a material impact on overall returns.
Past performance is not indicative of future results and the performance of a specific individual client account may vary substantially from the composite performance results. Therefore, no current or prospective client should assume that future performance will be profitable, or equal either the KCM composite performance results reflected above, or the performance results for any of the comparative index benchmarks provided.
For reasons including variances in portfolio account holdings, variances in the investment management fee incurred, market fluctuations, the date on which a client engages KCM’s investment management services, and any account contributions or withdrawals, the performance of a specific client’s account could vary substantially from the indicated KCM composite performance results. A portion of each account can be actively managed in an attempt to respond to changing conditions.
All performance results have been compiled solely by KCM, are unaudited, and have not been independently verified. Therefore, the performance data could be wrong. Information pertaining to KCM’s advisory operations, services, and fees is set forth in KCM’s current Form ADV Part 2A disclosure brochure, a copy of which is available from KCM upon request.
iShares IWM is an exchange-traded fund (ETF) measuring the performance of approximately 2,000 small-cap companies. It serves as a benchmark for small-cap stocks in the United States.
KCM managed accounts may own assets and follow investment strategies which cause them to differ materially from the composition and performance of the ETF shown as a benchmark. The ETF was chosen for its accessibility, transparency, independence, and relevance to KCM’s investment strategy, but there may be other indices that are more appropriate or applicable to the Concentrated Micro-cap Strategy. The historical index performance results are provided exclusively for comparison purposes only, so as to provide general comparative information to assist an individual client or prospective client in determining whether a specific Portfolio meets, or continues to meet, his/her investment objective(s). It should not be assumed that account holdings will correspond directly to any of the comparative indexes.
Different types of investments and/or investment strategies involve varying levels of risk, and there can be no assurance that any specific investment or investment strategy (including the investments purchased and/or investment strategies devised by KCM) will be either suitable or profitable for a client’s or prospective client’s portfolio and may result in a loss of principal. Accordingly, no client or prospective client should assume that the above portfolios (or any component thereof) serve as the receipt of, or a substitute for, personalized advice from KCM, or from any other investment professional.