
“Stock market bubbles don’t grow out of thin air. They have a solid basis in reality, but reality as distorted by a misconception.”
| Year | KCM Composite, Net | IWM | Excess Return |
|---|---|---|---|
| 2017* | 27.20% | 14.26% | +12.94% |
| 2018 | -3.43% | -11.11% | +7.68% |
| 2019 | 27.79% | 25.39% | +2.40% |
| 2020 | 27.52% | 20.03% | +7.49% |
| YTD 2021 | 10.06% | 12.90% | -2.84% |
| Annualized | 20.90% | 14.01% | +6.89% |
*Inception date: 02/01/2017
Introduction
If you’ve been paying attention to the stock market recently you’ve probably noticed some strange behavior. Take Gamestop (GME) for instance, a brick-and-mortar video game retailer whose business has been in decline for years due to the growing adoption of digital downloads and online gaming. In January, the stock gained $1,600% – going from under $20 per share to nearly $350 per share – over the course of two weeks. The stock came crashing back to earth over the next several weeks, falling 88%, only to shoot back up 551% by the middle of March. Or consider BB Liquidating Inc. (BLIAQ), the company formerly known as Blockbuster Video. Its stock price exploded 1,830% over two days, only to fall 80% over the next several weeks. Price movements like those seen in Gamestop, Blockbuster and a host of others are unusual to say the least. And given that the benchmark is up over 130% since bottoming out in March of last year, many investors have started to wonder whether or not we are in a bubble. So, are we in a bubble and if so, what should we do?
First, it is important to understand what a bubble is. Bubbles tend to be characterized by three main aspects:
Lofty valuations – According to Investopedia, “a bubble generally refers to a situation where the price for something exceeds its fundamental value by a large margin. Because speculative demand, rather than intrinsic worth, fuels the inflated prices, the bubble eventually but inevitably pops…”
Investor excitement/ overconfidence – According to the Nobel Prize winning economist Robert Shiller, bubbles are social-psychological phenomena that occur when news of price increases spur investor enthusiasm. As Warren Buffett has said “(bubbles occur when) people start being interested in something because it’s going up, not because they understand it or anything else. But the guy next door, who they know are dumber than they are, is getting rich and they aren’t. And their spouse is saying can’t you figure it out too? It is so contagious.”
Extreme leverage (i.e., the use of debt) – Investors, buoyed by price increases and extreme optimism, tend to take on more debt in a bubble to try and juice returns. But excess debt can make a portfolio more susceptible to market downturns and amplify a bubble’s eventual pop.
So, how do we know if any of these conditions exist today? First let’s look at valuation. One of the most popular ways to measure overall market valuation is by the Cyclically Adjusted Price to Earnings (CAPE) ratio, which compares the price of the S&P 500 index to the earnings power of its constituents over the previous ten years, adjusted for inflation. Currently the CAPE ratio is around 36, which compares to its historical average of roughly 17. This implies that the stock market is about 110% overvalued and suggests that we are now in a significant bubble. However, this assessment is a bit over simplistic since it does not account for interest rates or corporate earnings growth – key drivers of stock market valuation. And over the 140 years of CAPE data available, interest rates have been much higher on average than they are today. Therefore, to better understand overall market valuation, it is important to compare the current CAPE ratio to what one would expect based on historical interest rates and corporate earnings growth as shown in the chart below:
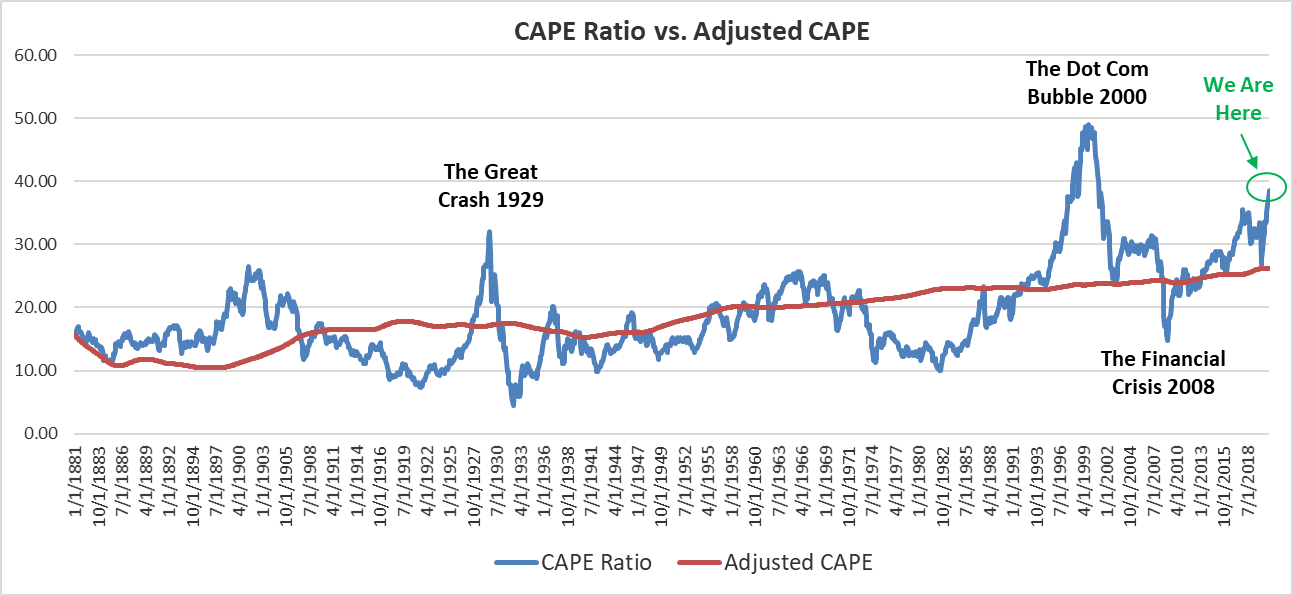
The red line in the chart above is an estimate I created of what the CAPE ratio should be based on interest rates, equity risk premiums and corporate earnings growth, and the blue line is the actual CAPE ratio. As you can see, the blue line tends to follow the overall trend of the red line but with significant variation along the way. The farther above or below the blue line is from the red line, the more over or undervalued the market is. Based on this analysis, the stock market is approximately 47% overvalued at the time of this writing – a lofty valuation for sure but only about halfway to the levels seen at the peak of the dot com bubble and the great crash of 1929. Therefore, based on valuation alone, one might conclude that we are not quite in a bubble yet, but we seem to be getting close.
Next lets explore investor sentiment to see whether market participants are overly optimistic. There are a number of quantitative measures that aim to gauge market sentiment including the CBOE Volatility Index (VIX), which looks at the market’s expectations for near-term price changes, the put to call ratio, which compares the number of optimistic bets to pessimistic bets on the market, and the 50-day and 200-day moving averages, which measure the market’s short-term and long-term momentum. But I prefer the CNN Business Fear & Greed Index, which combines seven different market indicators to judge the level of fear and greed in the market on a scale from 0 – 100, with 0 being extreme fear and 100 being extreme greed. As of today, the Index stands at about 60, indicating a moderate level of greed in the market. Therefore, this metric reinforces the notion that we are not quite in a bubble yet but may be getting close.
Finally, lets examine the amount of leverage in the market. When investors borrow money to purchase stocks it is called trading on margin. Excessive amounts of margin indicate that investors are generally euphoric about stocks. But margin can also exaggerate market crashes. Because when stocks unexpectedly fall, the amount of collateral in an investor’s account becomes insufficient. And when that happens, investors receive a mandate from their broker to add money or securities to their account – known as a margin call. But to comply with a margin call, investors and their banks are often forced to sell securities, which creates a vicious cycle of downward pressure on stock prices followed by further margin calls. Consequently, by looking at total margin debt as a percentage of GDP we can get a sense for how much leverage is in the system and if a bubble is forming, as shown in the chart below:
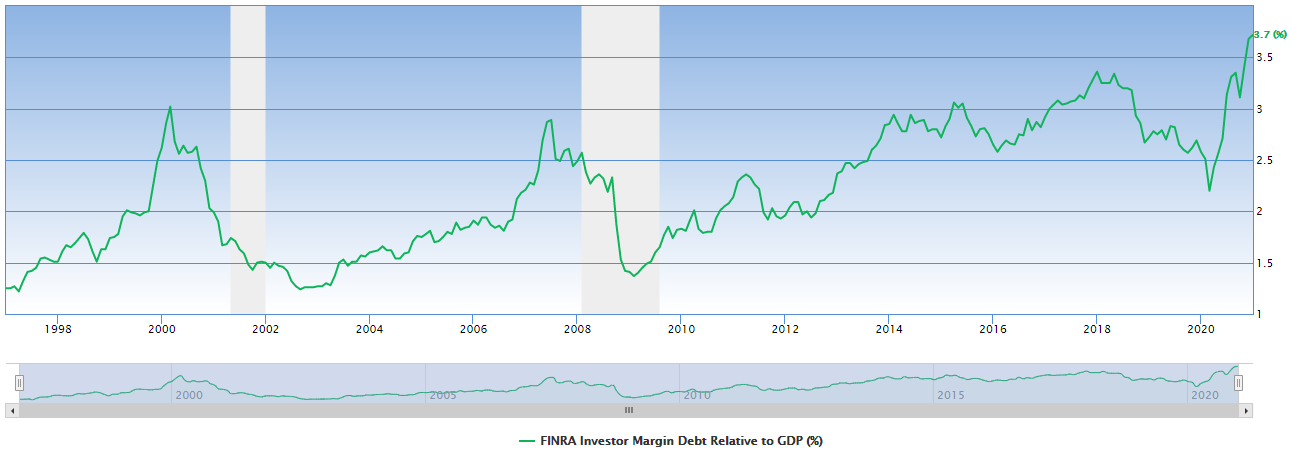
As you can see, margin debt was 3.7% of U.S. GDP at the end of January, or almost $800B in total. Looking back at the chart we can also see that this level of margin debt is the highest in recorded history – even higher than during the dot com bubble in 2000 and the financial crisis in 2008. Based on this metric, it appears that a bubble is well underway.
So, where does that leave us? Evaluating all three data points together – valuation, investor sentiment, and margin debt – suggests that we may be in the middle to late stages of a bubble. But it’s important to note that bubbles are difficult to predict and often inflate over many years. The bubble prior to the great crash of 1929 grew for about 8 years before popping. The dot com bubble expanded over roughly 18 years. And the housing market bubble developed over 10 years. By contrast, we appear to be about 11 years into this bubble and only halfway to dot com level valuations. As a result, prices could still go much higher from here. But as Warren Buffett has said, “speculation is most dangerous when it looks easiest.” So how should one position themselves in this type of environment? Our strategy is to maintain exposure to the stock market while limiting downside risk. This involves avoiding leverage, investing in businesses at reasonable prices (i.e., stocks not participating in the bubble), and holding a moderate amount of cash. While it is possible (and perhaps likely) that this approach underperforms for a time, I believe it best positions us to make opportunistic investments amid market downturns and earn satisfactory long-term returns.
Performance
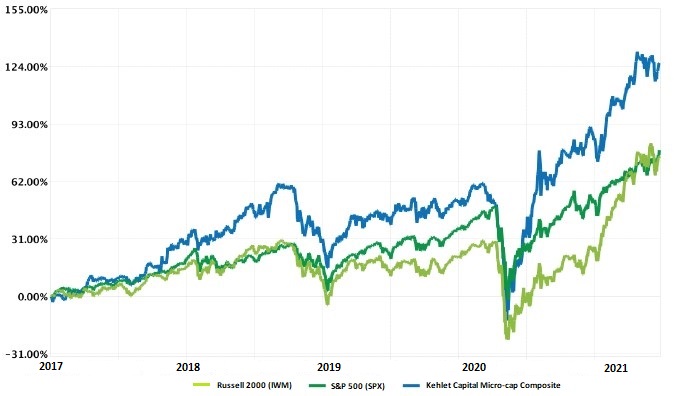
During the first quarter of 2021, Kehlet Capital Management’s concentrated micro-cap composite increased 10.06%, moderately underperforming the benchmark which grew 12.90%.
For the second straight quarter our largest contribution to performance came from Astronics Corp. (ATRO), which returned 36.68%. In last quarter’s newsletter I noted how one of the two major headwinds facing the company – the grounding of the Boeing 737 MAX – had been resolved. And in the first quarter, the other headwind – COVID-19 – began showing signs of easing as vaccines rolled out nationwide, daily new cases fell sharply, and various restrictions were lifted. While we are not quite out of the woods yet with COVID-19 there appears to be some light at the end of the tunnel. This is especially good news for Astronics, whose business depends on a healthy travel industry. As a result, I believe the stock still has room to run and should provide adequate returns over the next 1 – 3 years. Consequently, it remains our second largest position.
For the first quarter the largest detractor to performance was Bandwidth Inc. (BAND), which declined 16.91%. I’ve spoken extensively in previous newsletters about Bandwidth, my investment thesis and why I am extremely bullish on the company over the long-term. But during the first quarter, Bandwidth’s stock, along with the entire technology sector, came under pressure due to concerns about potential inflation and rising interest rates. However, Bandwidth’s decline appears to be a case of the baby being thrown out with the bath water since the fundamentals of the business have only grown stronger (and at an accelerating pace). As such I added to our position during the first quarter, and it is now the third largest in the portfolio.
Portfolio Activity
I initiated a new position in the fourth quarter of 2020 but was unable to build a full position this quarter. I will introduce the company and discuss the investment thesis as soon as I do. I also made a few adjustments to portfolio weights by reducing our position in Callaway Golf (ELY) and adding to our positions in Bandwidth (BAND) and Fonar Corp. (FONR).
Conclusion
Though the first quarter was adequate from an absolute return perspective – we were up over 10% – it was subpar on a relative basis – we underperformed the benchmark by almost 3%. While I would prefer to see outperformance every quarter it would be unrealistic to expect it, especially if a bubble is inflating. The truth is our approach to minimizing risk makes it difficult to keep up with the market during periods of extreme risk-taking. But that is okay because the goal is not to maximize short-term gains but rather to position the portfolio to outperform over the long-term. And by doing so provide investors with satisfactory, long-term, risk-adjusted returns across all market environments. As always, thank you for supporting Kehlet Capital Management, and please do not hesitate to contact me should you have any questions or comments.
| Number of holdings | 10 |
|---|---|
| Median market cap | $912M |
| Weighted avg. market cap | $1,127M |
| Fonar Corp. (FONR) | 17.4% |
|---|---|
| Astronics Corp. (ATRO) | 15.2% |
| Bandwidth Inc. (BAND) | 14.2% |
Disclosures to Performance Results
Actual composite performance results represent the performance of fully discretionary accounts managed by Kehlet Capital Management (KCM) during the corresponding time period. The composite performance results reflect time-weighted rates of return, the reinvestment of dividends and other account earnings. The reinvestment of dividends and other earnings may have a material impact on overall returns.
Past performance is not indicative of future results and the performance of a specific individual client account may vary substantially from the composite performance results. Therefore, no current or prospective client should assume that future performance will be profitable, or equal either the KCM composite performance results reflected above, or the performance results for any of the comparative index benchmarks provided.
For reasons including variances in portfolio account holdings, variances in the investment management fee incurred, market fluctuations, the date on which a client engages KCM’s investment management services, and any account contributions or withdrawals, the performance of a specific client’s account could vary substantially from the indicated KCM composite performance results. A portion of each account can be actively managed in an attempt to respond to changing conditions.
All performance results have been compiled solely by KCM, are unaudited, and have not been independently verified. Therefore, the performance data could be wrong. Information pertaining to KCM’s advisory operations, services, and fees is set forth in KCM’s current Form ADV Part 2A disclosure brochure, a copy of which is available from KCM upon request.
iShares IWM is an exchange-traded fund (ETF) measuring the performance of approximately 2,000 small-cap companies. It serves as a benchmark for small-cap stocks in the United States.
KCM managed accounts may own assets and follow investment strategies which cause them to differ materially from the composition and performance of the ETF shown as a benchmark. The ETF was chosen for its accessibility, transparency, independence, and relevance to KCM’s investment strategy, but there may be other indices that are more appropriate or applicable to the Concentrated Micro-cap Strategy. The historical index performance results are provided exclusively for comparison purposes only, so as to provide general comparative information to assist an individual client or prospective client in determining whether a specific Portfolio meets, or continues to meet, his/her investment objective(s). It should not be assumed that account holdings will correspond directly to any of the comparative indexes.
Different types of investments and/or investment strategies involve varying levels of risk, and there can be no assurance that any specific investment or investment strategy (including the investments purchased and/or investment strategies devised by KCM) will be either suitable or profitable for a client’s or prospective client’s portfolio and may result in a loss of principal. Accordingly, no client or prospective client should assume that the above portfolios (or any component thereof) serve as the receipt of, or a substitute for, personalized advice from KCM, or from any other investment professional.