
“Over the long term, it’s hard for a stock to earn a much better return than the business which underlies it earns. If the business earns 6% on capital over 40 years and you hold it for that 40 years, you’re not going to make much different than a 6% return – even if you originally buy it at a huge discount. Conversely, if a business earns 18% on capital over 20 or 30 years, even if you pay an expensive looking price, you’ll end up with a fine result.”
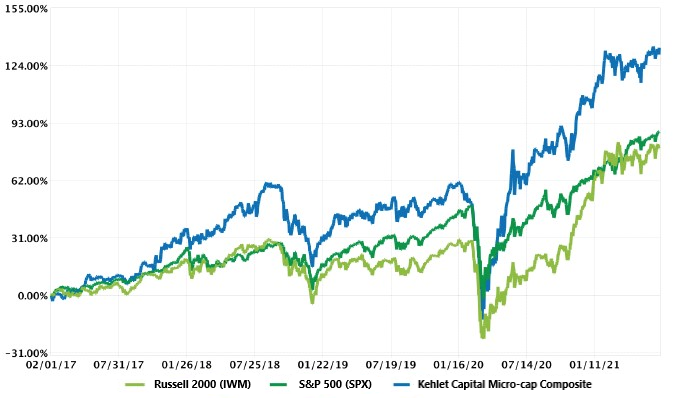
| Year | KCM Composite, Net | IWM | Excess Return |
|---|---|---|---|
| 2017* | 27.20% | 14.26% | +12.94% |
| 2018 | -3.43% | -11.11% | +7.68% |
| 2019 | 27.79% | 25.39% | +2.40% |
| 2020 | 27.52% | 20.03% | +7.49% |
| YTD 2021 | 15.99% | 17.38% | -1.39% |
| Annualized | 21.04% | 14.18% | +6.86% |
*Inception date: 02/01/2017
Introduction
In previous newsletters I’ve discussed various topics of interest ranging from inflation to artificial intelligence to Bitcoin. But up until now I have rarely talked about investing specifically. For the most part, I felt that the best insights had already been said by people much smarter than myself – people like Ben Graham, Warren Buffett, Charlie Munger, Phil Fisher, Bruce Greenwald, Howard Marks, Mohnish Pabrai, and a host of others – and I didn’t have anything new to add to the conversation. But after nearly a decade of refining my investment process, I now realize that it has some unique elements to it. So, over the next few newsletters I will lay out my framework for investing, how I analyze businesses, and what I believe separates the great ones from the rest – and hopefully provide some interesting ideas along the way. It is important to note however, that this framework is and always will be a work in progress. Investing is a complex and competitive game that is constantly evolving. To be successful at it, one must be willing to update old ideas to incorporate new information. As a result, I welcome any critiques you may have. If you believe I have made an error anywhere, please do not hesitate to set me straight. So, without further ado, here is my investing framework:
Arguably the most important metric in investing is the return on invested capital (ROIC) a business earns over time. Why? Because as Charlie Munger notes in the quote above, if you own a stock for a long time, the return you receive as an investor is likely to match the ROIC of the underlying business, regardless of the price paid.1 This is true irrespective of industry – whether it’s manufacturing, distribution, or software. Simply put, long-term investing boils down to finding businesses capable of investing large amounts of capital at high rates of return over time.
But how does one identify those types of businesses? To do that requires a deeper dive into the characteristics of ROIC. In short, there are two ways to look at it; quantitatively and qualitatively. Let’s start with the quantitative method (yes there will be some math, but I promise it is mostly simple arithmetic). Mathematically, ROIC is the annual after-tax operating profit a company generates divided by the total capital (i.e., debt + equity) it invests in the business, as shown in the formula below:
However, this equation doesn’t provide us with much insight other than a business needs to earn lots of profits with very little capital. Therefore, it can be helpful to look at it through the lens of a DuPont Analysis. Popularized by the DuPont Corporation, a DuPont analysis decomposes return on invested capital into the various factors that impact it – profit margin, asset turnover, and financial leverage. Where profit margin is the earnings a business generates on each dollar of revenue, asset turnover measures how efficiently a business uses its assets (i.e., inventory, equipment, property, etc.) to generate revenue, and financial leverage measures how much capital needs to be invested by the company to acquire those assets. Mathematically, it looks like this:
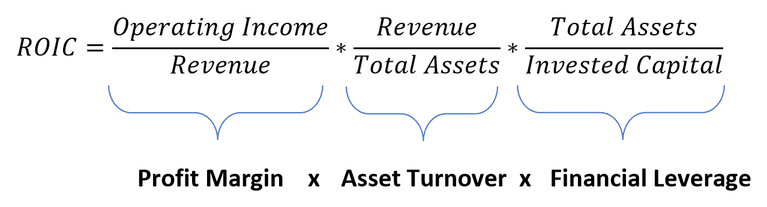
The astute reader will notice that revenue and total assets are in both the numerator and the denominator and thus cancel each other out, which leaves us with our original equation for ROIC. But looking at it in this expanded way, we see that a company can achieve above average return on invested capital in three ways:
By earning high margins. For example, the car manufacturer Ferrari – which sells automobiles for hundreds of thousands of dollars or more – typically generates over 20% operating margins. These high margins help to offset the low volume of vehicles the company sells in a given year (i.e., it’s low asset turnover), resulting in a respectable ≈ 12% return on invested capital.
By being asset light. For example, the transportation and logistics company C.H. Robinson produces relatively low operating margins – roughly 5%. But the company is extremely asset-light because it does not own the trucks it uses to conduct business; its drivers do. As a result, C.H. Robinson earns exceptional returns on its invested capital of approximately 15% - 20%, despite having low margins.
By being capital light. For example, car insurance companies like Geico tend to be low margin and asset intensive, but still earn exceptional ROIC due to the low requirements for external capital. That is, because these businesses receive monthly premiums from their policyholders, but don’t typically pay out claims until many years later, they can invest these funds – known as “float” – in the interim at virtually no cost. It’s like borrowing money at 0% interest and then investing it at 10%+ annual returns before paying off the loan and pocketing the difference. It is equivalent to free money, which makes these types of businesses extremely capital-light.
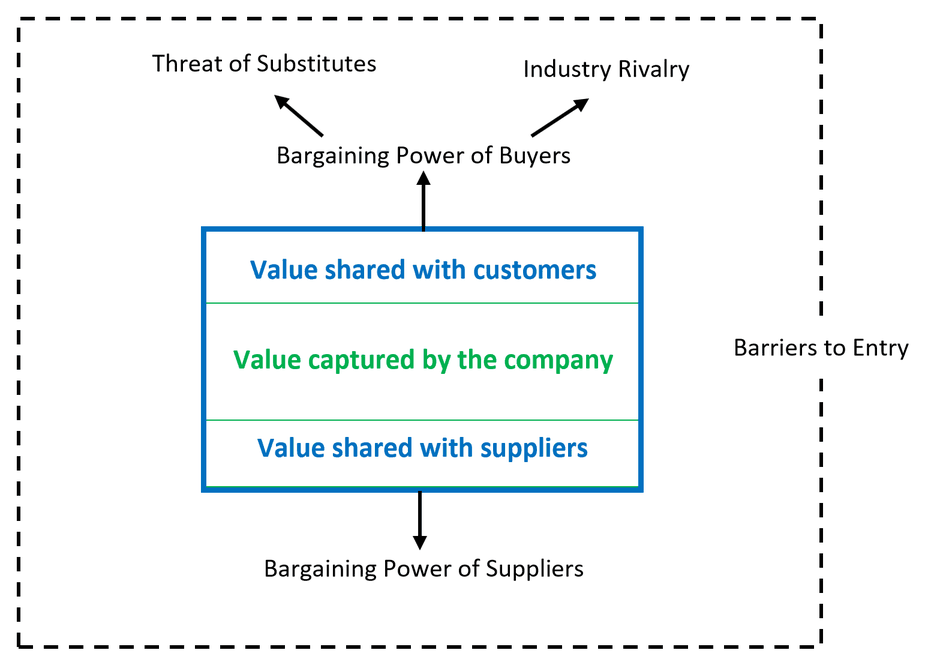
And that brings us to the qualitative approach to ROIC, known as Porter’s 5 Forces. Porter’s 5 Forces is a framework, developed by Harvard Professor Michael Porter in 1979, for analyzing the competitive intensity and attractiveness of an industry in terms of profitability. Not surprisingly, there are five forces in Porter’s framework, which are represented graphically below:
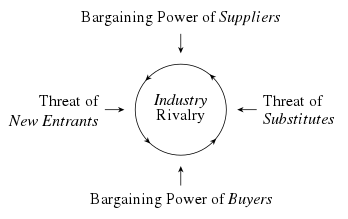
The Porter’s 5 Forces framework asserts that the combined strength of these forces determines an industry’s profitability (and thus it’s ROIC). At the time, the concept was a significant leap forward in the understanding of business dynamics and is still widely used in professional investment analysis. But, in my opinion, the framework has never been very intuitive. While Porter’s 5 Forces does a great job of identifying and analyzing the various characteristics that impact an industry, it is highly subjective and does little to explain how the forces interact with each other or what impact they have on profitability. Therefore, I prefer to view Porter’s 5 Forces a little differently. And it starts with the concept of value creation. That is, every business that wants to make money must create value for its customers. This value can come in several forms – such as cost savings, time savings, or emotional connection – and varying quantities. For example, let’s say I want to buy a new house. I can buy all the materials, learn how to build a house, and build it myself. Or I can hire a homebuilder to do it much faster and cost effectively than me. Simply put, hiring a homebuilder saves me an enormous amount of time and money and would almost certainly be worth the cost. On the other hand, if I need my lawn mowed, I can pay someone $30+ a week, or I can do it myself for free. Hiring someone saves me time, but if I value my time at less than $30 an hour, the savings would not be worth the cost.2 Consequently, any business that wants to earn high margins, must first create significant value for its customers. The greater the pain point solved, the greater the potential for profit.
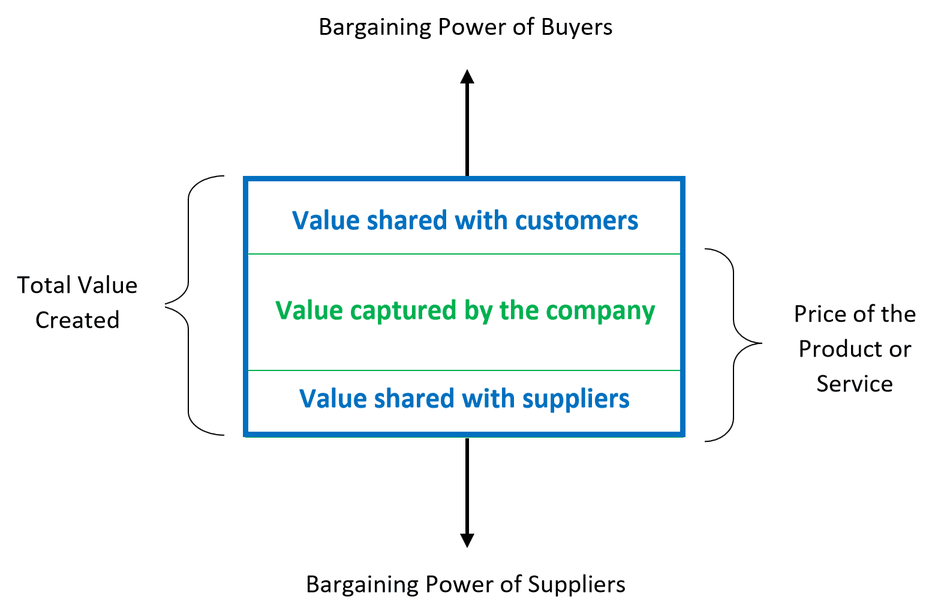
But the analysis doesn’t end there. A business must then share the value it creates with its customers and suppliers, otherwise there is no incentive for them to transact. But how much value should be kept by the customer? How much by the suppliers? And how much by the company itself? Figuring this out is effectively a negotiation of price – both the price of the product or service and the cost of its inputs. And this is where Porter’s 5 forces comes in. Because in any negotiation, the key factor is the relative bargaining power of the individual participants, which ultimately determines how much value each stakeholder will be able to capture. Graphically it might look something like this:
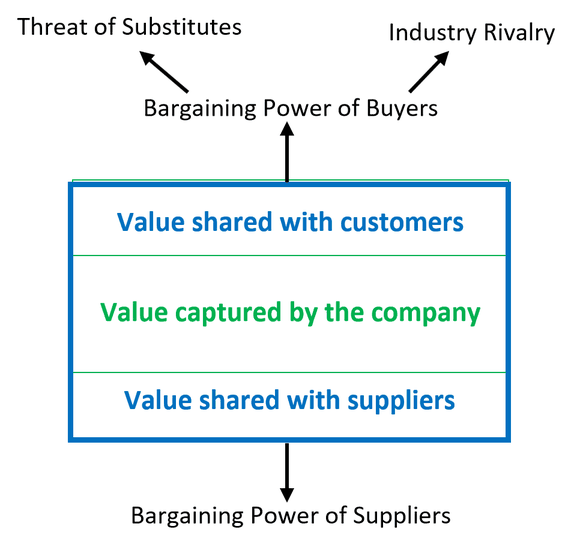
But this only incorporates two of Porter’s five forces. What about the other forces? I would argue that the presence of substitute products (i.e., products that are different but provide a similar benefit – like tea and coffee) and aggressive competitive rivalry are both factors that add to a customer’s bargaining power in the negotiation over price. In other words, if a potential customer has suitable alternative options, they have significant bargaining power. Therefore, two of the forces mentioned previously – threat of substitutes and industry rivalry – are a subset of the bargaining power of buyers. Consequently, we can add them to the previous graphic as follows:
Which leaves us with Porter’s final force – barriers to entry. Barriers to entry are factors that inhibit new or existing competitors from entering a company’s particular market segment or niche. As such, they can be thought of as protection – or a moat – around the business. Simply put, they provide a gauge for the sustainability of a business’s relative bargaining power and its ability to maintain its profit margins over time. Therefore, we can add the final force to our diagram as follows:
To summarize, highly profitable businesses generally have three main characteristics:
A product or service that creates significant value for the customer
Substantial bargaining power that enables them to capture a large portion of the value they create
High barriers to entry that allow them to sustain (or grow) their bargaining power over time
And this is the qualitative framework I use to determine a company’s ability to generate profits over time. But the analysis is still incomplete. First, we need a way to objectively gauge the strength of each force to accurately determine a business’ profit potential. And second, we need to merge the narrative with the numbers. That is, we need to combine the modified Porter’s 5 Forces qualitative framework with the quantitative DuPont analysis to see how profitability impacts ROIC. And in next quarter’s newsletter I will discuss both of these items. So, stay tuned…
Performance
During the second quarter of 2021, Kehlet Capital Management’s concentrated micro-cap composite increased 5.39%, moderately outperforming the benchmark which grew 3.97%.
Our largest contribution to performance came from Callaway Golf (ELY), which returned 26.38%. The company’s results were likely driven by four events: 1) the completion of the Topgolf acquisition at the end of the first quarter, which increased Callaway’s growth potential, 2) reporting of strong first quarter results, which included 47% growth in revenue and a 122% rise in adjusted operating income, 3) Callaway Pro Phil Mickelson, at age 50, becoming the oldest ever major champion by winning the PGA Championship (while using Callaway clubs and balls), and 4) Callaway Pro Jon Rahm winning his first major championship at the U.S. Open and crediting Callaway in a post event interview, saying “my new equipment allowed me to hit shots that I simply wasn’t capable of before.” In short, the company’s momentum appears quite strong and potential synergies between Topgolf and Callaway remain significant. Some of the potential synergies include:
More prominent Callaway product placement and advertising within Topgolf locations
Increased potential to convert non-golfers to the game of golf with Callaway fitting rooms and educational resources
Increased Callaway marketing effectiveness using Topgolf and Toptracer customer data
Improved Toptracer sales to third party driving ranges by accessing Callaway’s existing relationships
As a result, I remain quite bullish on the name, and it remains our third largest position.
The largest detractor to performance in the second quarter was Chase Corp. (CCF), which declined 11.90%. As a reminder, Chase is a manufacturer of protective materials such as tapes, sealants, adhesives, and coatings, used for high reliability applications across a broad range of markets. Their products include coatings that protect electronic circuit boards from damage and corrosion, sealants used to insulate and shield communications cables, and tapes used to waterproof large pipelines.
During the second quarter the company reported its financial results, which showed revenue growth of just over 4% and adjusted operating income growth of 26% year-over-year. Chase also announced the bolt-on acquisition of Emerging Technologies, Inc., a superabsorbent polymers solution provider, for $10 million. For those unfamiliar, superabsorbent polymers are substances capable of absorbing extremely large amounts of liquid relative to their own mass. They are typically used in diapers, sanitary napkins, industrial spill cleanup, and agricultural water protection and retention. Simply put, the acquisition of Emerging Technologies, Inc. provided Chase with another high-performance, environmentally friendly technology to add to its portfolio of specialty chemical solutions.
It is difficult however, to know precisely what caused the company’s poor stock price performance during the quarter. Potential culprits include rising raw material prices, automotive supply chain disruption, extended COVID-19 restrictions across Europe and other parts of the world, and normal stock price fluctuation. But all these items strike me as either temporary or highly manageable. And given Chase’s attractive valuation, strong balance sheet, and growth potential due, in part, to the recent $1 trillion infrastructure bill passed by the U.S. House of Representatives, I believe the company’s long-term prospects remain strong.
Portfolio Activity
I closed out our position in Hibbett Sports (HIBB) during the second quarter. Over the roughly one year we owned the stock it provided an annualized return of approximately 904% compared to an annualized return of about 115% for the benchmark. No that is not a typo. The stock really did return 904%, increasing from less than $8 per share in March 2020 to nearly $90 per share at the end of the second quarter. I initiated a position in Hibbett Sports in March 2020, near the bottom of the COVID-19 market downturn, when the company’s stock price had fallen over 71% from its previous twelve-month high. The thesis at the time was simple; the business was priced as if it was going to go bankrupt – it traded at 70% of tangible book value – and I felt strongly the company would survive intact. I knew Hibbett would be impacted by the COVID-19 shutdowns but felt the company would be able to weather the storm given their strong balance sheet, highly profitable business model, and complete lack of debt obligations. And that thesis quickly proved to be correct as restrictions were eased and businesses were allowed to operate in limited capacity. What I had not anticipated, however, was that pent-up demand, government stimulus, and competitor bankruptcies would provide a massive boost to the company’s financial results. For example, the company grew revenue by 20% and adjusted operating income by 167% in the fourth quarter of 2020 compared to the (Pre-COVID) fourth quarter the prior year. As a result, the stock performed better than my wildest expectations – my only regret is not having bought more. And although it still had positive momentum – and one year is a shorter holding period than I would normally prefer – the thesis had played out and I felt it was important to exit before Hibbett came up against some extremely difficult year-over-year comparisons.
On a side note, closing out the Hibbett Sports position currently leaves us with nine stocks in the portfolio. While I prefer to have at least ten, I am reluctant to add a subpar idea simply for the sake of diversification. And given the elevated valuations in the market (see my previous newsletter about bubbles), high quality ideas are difficult to find at the moment. Therefore, I will continue to search diligently for a tenth name to add to the portfolio, but it may take several quarters before a suitable replacement is found. I will keep you updated on my progress.
Finally, I made a few adjustments to portfolio weights during the quarter by reducing our position in Astronics (ATRO) and adding to our positions in Bandwidth (BAND) and Fonar Corp. (FONR).
Conclusion
While the second quarter was satisfactory from both an absolute and relative performance perspective, good investment ideas are becoming harder to come by. As a result, our portfolio has gradually become more concentrated in my top three or four highest conviction ideas. Although this may result in higher than normal volatility in the portfolio, I believe it best positions us to outperform in the current environment while still minimizing downside risk. As always, thank you for supporting Kehlet Capital Management, and please do not hesitate to contact me should you have any questions or comments.
| Number of holdings | 9 |
|---|---|
| Median market cap | $853M |
| Weighted avg. market cap | $1,664M |
| Fonar Corp. (FONR) | 19.5% |
|---|---|
| Bandwidth Inc. (BAND) | 17.6% |
| Callaway Golf (ELY) | 12.0% |
Notes
Disclosures to Performance Results
Actual composite performance results represent the performance of fully discretionary accounts managed by Kehlet Capital Management (KCM) during the corresponding time period. The composite performance results reflect time-weighted rates of return, the reinvestment of dividends and other account earnings. The reinvestment of dividends and other earnings may have a material impact on overall returns.
Past performance is not indicative of future results and the performance of a specific individual client account may vary substantially from the composite performance results. Therefore, no current or prospective client should assume that future performance will be profitable, or equal either the KCM composite performance results reflected above, or the performance results for any of the comparative index benchmarks provided.
For reasons including variances in portfolio account holdings, variances in the investment management fee incurred, market fluctuations, the date on which a client engages KCM’s investment management services, and any account contributions or withdrawals, the performance of a specific client’s account could vary substantially from the indicated KCM composite performance results. A portion of each account can be actively managed in an attempt to respond to changing conditions.
All performance results have been compiled solely by KCM, are unaudited, and have not been independently verified. Therefore, the performance data could be wrong. Information pertaining to KCM’s advisory operations, services, and fees is set forth in KCM’s current Form ADV Part 2A disclosure brochure, a copy of which is available from KCM upon request.
iShares IWM is an exchange-traded fund (ETF) measuring the performance of approximately 2,000 small-cap companies. It serves as a benchmark for small-cap stocks in the United States.
KCM managed accounts may own assets and follow investment strategies which cause them to differ materially from the composition and performance of the ETF shown as a benchmark. The ETF was chosen for its accessibility, transparency, independence, and relevance to KCM’s investment strategy, but there may be other indices that are more appropriate or applicable to the Concentrated Micro-cap Strategy. The historical index performance results are provided exclusively for comparison purposes only, so as to provide general comparative information to assist an individual client or prospective client in determining whether a specific Portfolio meets, or continues to meet, his/her investment objective(s). It should not be assumed that account holdings will correspond directly to any of the comparative indexes.
Different types of investments and/or investment strategies involve varying levels of risk, and there can be no assurance that any specific investment or investment strategy (including the investments purchased and/or investment strategies devised by KCM) will be either suitable or profitable for a client’s or prospective client’s portfolio and may result in a loss of principal. Accordingly, no client or prospective client should assume that the above portfolios (or any component thereof) serve as the receipt of, or a substitute for, personalized advice from KCM, or from any other investment professional.