
“Be fearful when others are greedy and … greedy only when others are fearful.”
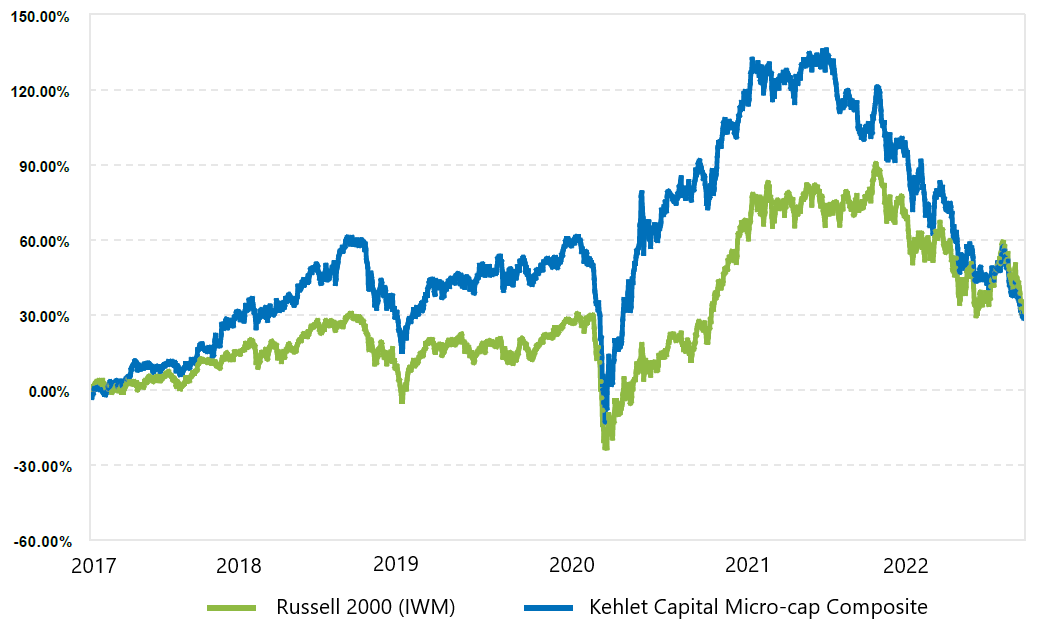
| Year | KCM Composite, Net | IWM | Excess Return |
|---|---|---|---|
| 2017* | 27.20% | 14.26% | +12.94% |
| 2018 | -3.43% | -11.11% | +7.68% |
| 2019 | 27.79% | 25.39% | +2.40% |
| 2020 | 27.52% | 20.03% | +7.49% |
| 2021 | -1.45% | 14.54% | -15.99% |
| YTD 2022 | -35.02% | -25.13% | -9.89% |
| Annualized | 4.48% | 4.90% | -0.42% |
*Inception date: 02/01/2017
Introduction
Despite declines in the overall market and KCM’s underperformance over the last two years, I have regularly emphasized the need for patience and reiterated my confidence in the long-term potential of our portfolio. As the market has continued to fall, and our investments have become relatively more attractive, the need for patience has remained but my confidence has slowly morphed into excitement. So, in this quarter’s newsletter I want to share the reasons for my excitement by digging deeper in to our three largest holdings – Fonar Corp. (FONR), Wayside Technology Group (WSTG), and Bandwidth Inc. (BAND) – and why I believe they represent such compelling investment opportunities.
First, it’s no secret that good investing boils down to maximizing your return on investment. But it’s important to note that returns can primarily come from two sources – earnings growth or multiple expansion.1 Earnings growth refers to the increase in earnings per share a company achieves during an investment holding period. For instance, if the earnings per share of a company grows by 30%, the stock price should also rise by 30%, all else being equal. Although earnings growth tends to be relatively modest over the short-term, it can be quite significant over long periods. On the other hand, multiple expansion refers to an increase in the amount of money the market is willing to pay per dollar of earnings. An example of this is when the price of an undervalued stock corrects to fair value without a corresponding increase in the earnings per share. Unlike earnings growth, multiple expansion can be quite meaningful in the short-term but tends to be relatively modest over the long-term. Consequently, the best investments often achieve a “double whammy” of both earnings growth and multiple expansion. And it’s this potential to achieve the coveted “double whammy” that has me so enthusiastic about our largest holdings.
First, consider the potential for multiple expansion with Fonar Corp. (FONR), our largest position. At the end of the third quarter FONR traded for $14.15 per share despite owning approximately $18.75 per share in net tangible assets (including $7.25 in cash) and earning $1.75 in after-tax net income. Simply put, purchasing Fonar stock at $14.15 would be a lot like buying a dollar for $0.75 and earning a (growing) dividend of $0.09 per year on top of that. In my opinion, it’s about as close to a no-brainer investment as you will ever find. As such, if Fonar’s stock price were simply to match the value of its net tangible assets, it would have the potential to return at least 33% from multiple expansion, even without any growth in the underlying earnings of the business.
Or consider our next largest position, Wayside Technology Group (WSTG). At the end of the third quarter, it traded at $26.88 per share despite having after-tax earnings of $2.57 over the trailing twelve months, for a price-to-earnings (P/E) multiple of about 10.5x. In other words, an investment in Wayside Technology at $26.88 would provide an earnings yield – the inverse of the earnings multiple – of approximately 9.5%. Even in today’s higher interest rate environment, that would be quite a generous return for a “no growth” business. But Wayside isn’t a “no growth” business. In fact, it has increased its adjusted earnings per share2 by a compound annual growth rate (CAGR) of more than 19% since current management took over 4.5 years ago. And I believe the company can continue to grow by at least 5% annually going forward. Therefore, in my opinion, Wayside’s earnings multiple should (conservatively) trade closer to 16x, which would imply a potential return of more than 50% from multiple expansion alone.
Finally, consider Bandwidth Inc. (BAND), our third largest position. Bandwidth is more difficult to value than Fonar or Wayside because it has no earnings. That is, the company loses money on a generally accepted accounting principles (GAAP) basis. But Bandwidth’s business is unique, which makes reported earnings under GAAP accounting of limited use. Here is why. The idea behind GAAP accounting is to match the timing of revenues and expenses with the period in which they are earned or incurred. For example, let’s say you own a restaurant, and you need to buy an expensive new grilling station for your business. Because that gilling station is likely to provide a benefit (i.e., help you generate revenue) for many years to come, GAAP accounting calls for you to capitalize the cost of the equipment and record a depreciation expense throughout its estimated useful life, rather than expense the entire cost in the year it’s incurred. That way the expense is matched with the revenue. In most cases GAAP accounting does an excellent job at this matching process. But in Bandwidth’s case it does not. This stems from the fact that Bandwidth’s customers tend to be extraordinarily “sticky”. In other words, once a customer signs on with Bandwidth, they tend to remain customers for many years. As a result, much of the company’s sales and marketing expense can be thought of as a capital expenditure because it is likely to provide revenue benefits far beyond the year it is incurred. But GAAP accounting requires all these costs to be expensed upfront, which makes the income statement look worse than it should. For example, imagine you own a software business where customers subscribe to your software for $100 per year and maintain a subscription for an average of five years. If you spend $250 in sales and marketing to acquire each new customer, your income statement will show a loss of $150 per new customer in the first year, even though each customer will become highly profitable in subsequent years. And as you spend more and more to acquire new customers each year, the drag on your income statement will become larger and larger. As a result, the earnings of businesses like Bandwidth do not properly reflect economic reality. And so, we need a different way to value them. There are a number of complex valuation methods – such as discounted cash flow analysis – for valuing a company like Bandwidth. But for simplicity’s sake, let’s look at it this way. At the end of the third quarter Bandwidth’s stock price was $11.90, giving it an enterprise value (equity plus debt), conservatively calculated, of just under $650 million. If we assume Bandwidth’s steady state operating margins are 10% - which they achieved in 2016 and 2017 at much smaller scale – that would equate to roughly $39 million in net operating profit after-tax (NOPAT), for an EV/NOPAT multiple of ~16.5x.3 As shown in the previous example with Wayside, this is a reasonable multiple for a “low growth” business growing in the mid-single digits. But Bandwidth is not a “low growth” business. In fact, organic revenue growth has averaged nearly 20% since 2019 and total growth (including acquisitions) has averaged more than 30%. Therefore, if we conservatively estimate that the company can grow at 10% CAGR going forward, it’s multiple should be closer to 30x. This means that Bandwidth should be able to return at least 175% from multiple expansion, not including any further growth in the underlying earnings of the business.4
Now let’s look at the quality of each business and why I am so confident each one can achieve long-term growth equal to or better than my stated estimates – 0% for Fonar, 5% for Wayside, and 10% for Bandwidth.
So, what makes Fonar special? Well, for starters its founder, Dr. Raymond Damadian, invented the first ever MRI machine in 1977 and today the company makes the only upright MRI available in the United States. This is important because upright MRI’s are much better at detecting problems in the spine and neck area compared to traditional recumbent MRI’s – since patients are scanned in the weight-bearing position as opposed to lying down. Though Fonar no longer manufactures the upright MRI, it currently owns and operates about 30 of the 160 machines in operation in the U.S. today. This creates an enormous competitive advantage for the company’s diagnostic facilities by allowing them to offer a differentiated service that the vast majority of their competitors cannot. And it’s this differentiation that provides Fonar with a stable flow of patient referrals at high reimbursement rates and industry leading margins. But why am I so confident the company can achieve a minimum of 0% EPS growth over the long term? First, it’s important to note that Fonar has grown its revenue at 4.6% CAGR and its operating income per share by 1.6% CAGR over the last five years – above my 0% growth estimate. But that growth was achieved with minimal reinvestment in the business. In other words, as the company generated profits it chose to accumulate that cash on the balance sheet rather than reinvest it for growth. As a result, the cash balance ballooned from just over $10 million in 2017 to nearly $49 million today. But there are signs that Fonar’s strategy is beginning to shift. For example, after a long period of stability, the company has recently begun to open new locations and purchase additional MRI machines to increase its scanning capacity. As a result, capital expenditures have averaged $5 million over the last three years, up from an average of $2 million in the previous five. This has led to a 17% increase in the number of scanners managed by Fonar, with another 5% expected next fiscal year. Finally, and maybe most importantly, on September 26th, the Board of Directors announced a stock repurchase plan of up to $9 million. If executed at current prices, this buyback program would reduce the number of shares outstanding by roughly 10% and provide a huge tailwind to EPS. Therefore, I am highly optimistic that Fonar can achieve long-term growth of 0% and potentially much more.
What about Wayside? What makes that company so special? First of all, Wayside is a distributor of information technology (IT) software and solutions specializing in new and emerging technologies. By focusing on promising but lesser-known technologies the company occupies a unique niche in the market that helps them avoid direct competition with larger, more established distributors. Think of it like Trader Joe’s versus Wal-Mart. You won’t find most of the well-known brand names at Wayside (or Trader Joe’s), but you will find a unique assortment of products you can’t find anywhere else. But rather than operating a storefront like Trader Joe’s, Wayside operates as a direct sales organization similar to Mary Kay, Amway, or Tupperware. In other words, customers don’t typically find Wayside, Wayside finds them. Therefore, this is very much a “hustle” business. And it happens to be run by some of the best hustlers (in the best sense of the word) you will find, including CEO Dale Foster and Chief Marketing Officer Charles Bass. Consider Dale Foster’s track record. Before joining Wayside in January 2018, Mr. Foster was the CEO of another IT distributor, ProMark, for 20 years. During his time at ProMark he helped grow the company from ~ $26 million in sales in the early 2000’s to roughly $150 million when it was sold to Ingram Micro in 2012. By the time he left the company in 2017, it was doing approximately $580 million in sales.5 When Mr. Foster joined Wayside in 2018 its operating earnings per share had been down slightly over the previous six years. He immediately made changes to the organizational structure of the business, hired a number of former colleagues, including Charles Bass, and quickly re-accelerated growth. Since then, Wayside’s operating earnings per share have more than doubled – from $1.25 in 2017 to $2.62 over the last twelve months, as shown in the chart below:
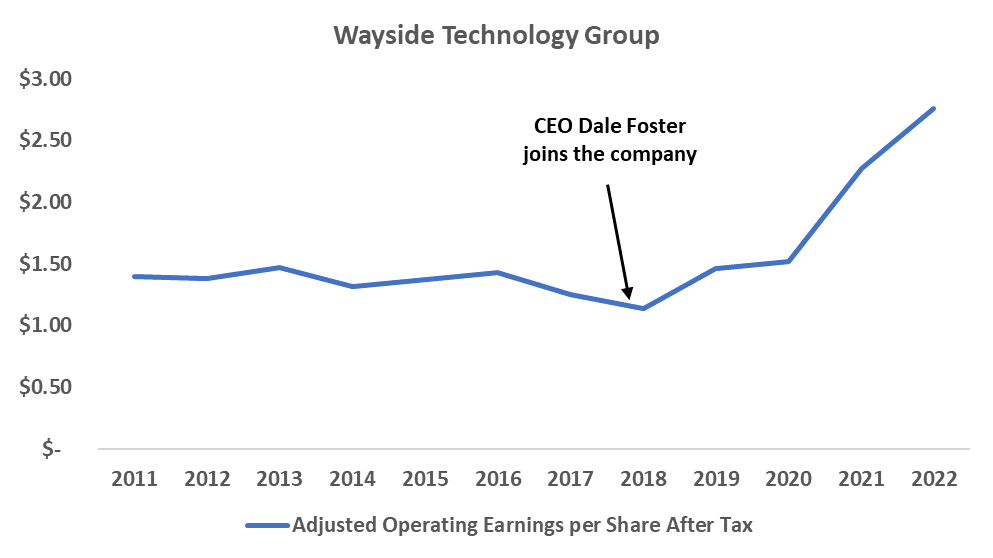
Consequently, I believe 5% long-term growth is a very conservative estimate. And given the company’s historical growth rate, the size of the overall IT market, and management’s capital allocation strategy, Wayside could quite possibly do even better than that.
Finally, what makes Bandwidth so special? It’s no secret that legacy communications, like phone calling and text messaging, have been gradually moving from the publicly switched telephone network (PSTN) to the internet. This is a trend that has been happening for many years. The reason is simple. By moving communications to the internet, and thus the cloud, it has enabled new features – like mobile & desktop app calling, voicemail transcription to email, and integration with productivity and collaboration software like Microsoft Teams and Salesforce CRM – all at lower cost than traditional phone service. But moving communications to the cloud is not an easy transition to make. It primarily requires two things, 1) expertise in both telecom technology and software development, and 2) network infrastructure. What makes Bandwidth unique is that virtually every other company in the industry has either the expertise (like Twilio) or the network (like Verizon or AT&T). But Bandwidth has both. This means that when the company competes against telecom incumbents (which is most of the time) they win because of their superior software and customer service. And when it competes against other software providers, like Twilio, it wins because of its superior network quality, control, and scalability. As different customers have explained it:
“(Other carriers) are not at Bandwidth’s level in terms of supporting customers through API’s and it’s a very manual process, whereas Bandwidth’s done a great job of doing it behind an API.”
“With CenturyLink we had (a) partnership… (but) we liked the way (Bandwidth’s) API was laid out. They had a powerful set of tools for us to integrate.”
“The quality of support and service that we got from (the incumbents) was terrible. The customer service manager would be non-responsive.... Bandwidth brought a team of people up (to our headquarters) to visit with us. It’s sort of like the annual, semi-annual visit to meet with everyone. We never had … any of the other big carriers do that with us.”
“Bandwidth actually does what Twilio does, and they do it better and cheaper.” 6
Accordingly, it’s this combination of technical expertise, software development skill, and ownership of the underlying network that provides Bandwidth with a meaningful competitive advantage. As further evidence, consider that the company is the primary provider for virtually every one of the largest cloud communications services in the U.S. including Microsoft Teams, Cisco Webex, RingCentral, and Zoom. More importantly, Bandwidth’s net revenue retention rate has averaged roughly 115% over the last seven years. This means that, not only do customers tend to stick around for many years, but they generally use more of the service each year – a strong indication that they are highly satisfied. Thus, given Bandwidth’s competitive advantage, highly satisfied customers, large market opportunity, and historical growth rates, I feel confident that the company can achieve a long-term growth rate of 10% and perhaps much more.
Performance
During the third quarter of 2022, Kehlet Capital Management’s concentrated micro-cap composite decreased 10.82%, underperforming the benchmark which fell 2.11%.
For the second quarter in a row, our largest contribution to performance came from LeMaitre Vascular (LMAT), which increased 10.65%. As a reminder, LeMaitre is a provider of medical devices for the treatment of peripheral vascular disease and has a portfolio of patent-protected, niche products designed for use in open vascular surgery.
During the third quarter LeMaitre reported its second quarter financial results, which included organic revenue growth of 8%. However, adjusted operating income fell nearly 20% compared to the prior year due to increased expenses from higher salesforce headcount and headwinds from foreign exchange rates due to a stronger U.S. dollar. As a result, management lowered its full year 2022 profitability guidance and now expects adjusted operating income to decline by approximately 8%. Though I still believe the long-term investment thesis for LeMaitre remains intact, I trimmed our position significantly in the third quarter given the disconnect between the stock’s price performance and its fundamentals as well as the significant opportunity to deploy capital into more attractive investments within the portfolio.
Our largest detractor to performance was Bandwidth Inc. (BAND), which declined 38.00%. During the third quarter Bandwidth reported its second quarter results, which included revenue growth of 13.1%. While financial results came in ahead of guidance, the company did report its first ever sequential decline in active customers (from 3,372 in Q1 to 3,362 in Q2). However, this appears to be related to a weakening macro-environment, rather than any industry or company specific slowdown. As management noted, Bandwidth “added new customers at a higher rate than the first quarter, but (saw) an uptick in non-regrettable churn amongst (its) smallest customers, the majority of which spend less than $5,000 annually” (compared to an average annual revenue per customer of $161,000 for the whole company). Although this uptick in churn will be something to keep an eye on going forward, I believe the fundamentals of the business remain strong, the company continues to invest heavily at high rates of return, and the stock trades at a dirt-cheap valuation. As such, I believe the thesis remains intact and I added to our position in the third quarter.
Portfolio Activity
During the third quarter I reduced our positions in LeMaitre Vascular (LMAT) and Topgolf Callaway Brands (MODG) – formerly known as Callaway Golf (ELY) – and increased our position in Bandwidth Inc. (BAND). No other adjustments to portfolio weights were made during the quarter.
Conclusion
I want to thank all the KCM clients who have remained steadfast during these difficult times. While many investment managers have faced redemptions and been forced to sell their holdings at unattractive prices, I have been blessed with clients who understand how markets work. The confidence you have shown in me during this period has been truly humbling, and I can’t help but to think what a privilege it is to work for such a fantastic group of investors. At the same time, I do not take the responsibility you have bestowed upon me lightly and will continue to do everything I can to position our portfolio for long-term success. In my opinion, our portfolio has rarely looked this good. But markets are difficult to predict, and it could take considerably more time before the value of our investments are realized. Better days are almost certainly ahead but, as always, patience will be the key. Thank you again for supporting Kehlet Capital Management, and please do not hesitate to contact me should you have any questions or comments.
| Number of holdings | 10 |
|---|---|
| Median market cap | $339M |
| Weighted avg. market cap | $340M |
| Fonar Corp. (FONR) | 28.5% |
|---|---|
| Wayside Technology (WSTG) | 15.6% |
| Bandwidth Inc. (BAND) | 10.4% |
Notes
- A third source of return is dividends. But, in many cases, this return is negligible compared to the other two. So, for our discussion we will focus solely on earnings growth and multiple expansion. ↩
- Excluding the amortization of acquired intangibles ↩
- Assumes an effective tax rate of 25% ↩
- Because we are using EV/NOPAT instead of P/E, the company benefits from leverage in its capital structure. That is, Bandwidth’s use of debt means an ~ 80% increase in multiple (from 16.5x to 30x) equates to an even larger increase in equity value, or stock price (~ 175%). ↩
- Based on KCM’s conversations with Wayside’s management ↩
- Source: Various expert interview transcripts on the Tegus research platform ↩
Disclosures to Performance Results
Actual composite performance results represent the performance of fully discretionary accounts managed by Kehlet Capital Management (KCM) during the corresponding time period. The composite performance results reflect time-weighted rates of return, the reinvestment of dividends and other account earnings. The reinvestment of dividends and other earnings may have a material impact on overall returns.
Past performance is not indicative of future results and the performance of a specific individual client account may vary substantially from the composite performance results. Therefore, no current or prospective client should assume that future performance will be profitable, or equal either the KCM composite performance results reflected above, or the performance results for any of the comparative index benchmarks provided.
For reasons including variances in portfolio account holdings, variances in the investment management fee incurred, market fluctuations, the date on which a client engages KCM’s investment management services, and any account contributions or withdrawals, the performance of a specific client’s account could vary substantially from the indicated KCM composite performance results. A portion of each account can be actively managed in an attempt to respond to changing conditions.
All performance results have been compiled solely by KCM, are unaudited, and have not been independently verified. Therefore, the performance data could be wrong. Information pertaining to KCM’s advisory operations, services, and fees is set forth in KCM’s current Form ADV Part 2A disclosure brochure, a copy of which is available from KCM upon request.
iShares IWM is an exchange-traded fund (ETF) measuring the performance of approximately 2,000 small-cap companies. It serves as a benchmark for small-cap stocks in the United States.
KCM managed accounts may own assets and follow investment strategies which cause them to differ materially from the composition and performance of the ETF shown as a benchmark. The ETF was chosen for its accessibility, transparency, independence, and relevance to KCM’s investment strategy, but there may be other indices that are more appropriate or applicable to the Concentrated Micro-cap Strategy. The historical index performance results are provided exclusively for comparison purposes only, so as to provide general comparative information to assist an individual client or prospective client in determining whether a specific Portfolio meets, or continues to meet, his/her investment objective(s). It should not be assumed that account holdings will correspond directly to any of the comparative indexes.
Different types of investments and/or investment strategies involve varying levels of risk, and there can be no assurance that any specific investment or investment strategy (including the investments purchased and/or investment strategies devised by KCM) will be either suitable or profitable for a client’s or prospective client’s portfolio and may result in a loss of principal. Accordingly, no client or prospective client should assume that the above portfolios (or any component thereof) serve as the receipt of, or a substitute for, personalized advice from KCM, or from any other investment professional.