
“I know so many people whose main problem in life is that (their) old ideas displace the entry of new ideas that are better… It’s very important, the habit of getting rid of dumb ideas.”
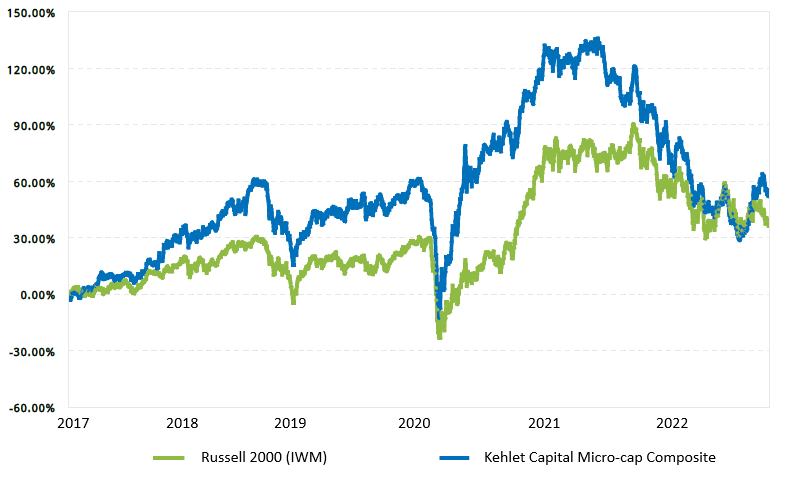
| Year | KCM Composite, Net | IWM | Excess Return |
|---|---|---|---|
| 2017* | 27.20% | 14.26% | +12.94% |
| 2018 | -3.43% | -11.11% | +7.68% |
| 2019 | 27.79% | 25.39% | +2.40% |
| 2020 | 27.52% | 20.03% | +7.49% |
| 2021 | -1.45% | 14.54% | -15.99% |
| 2022 | -22.63% | -20.48% | -2.15% |
| Annualized | 7.41% | 5.76% | +1.65% |
*Inception date: 02/01/2017
Introduction
With 2022 now in the books, Kehlet Capital Management has achieved nearly six years of investing performance. Looking back, I am proud that the fund has outperformed its benchmark since inception. But there is always room for improvement. Therefore, I have spent much of the past year evaluating my investment approach to see where it might be enhanced. The result has been several valuable lessons learned. And while the core principles of my strategy remain the same, I have used these lessons to fine-tune my investing process. Although the changes were minor, I am optimistic they will have a meaningful impact on performance going forward.
As I embarked on this journey, two observations stood out: 1) despite the fund’s recent underperformance, I still had conviction in the long-term potential of every stock in the portfolio, and 2) our best performing stocks had historically been some of our smallest positions, while our worst performers were often our largest positions – exactly the opposite of what you’d want. This led me to one conclusion; the area with the most potential for improvement was not necessarily selecting which companies to add to the portfolio but rather determining their position sizes once added. Which brought me to the first lesson learned:
Be systematic about position sizing. Until recently, my position sizing strategy had been simple: a 10% position for a fairly valued stock, ± 5% for over or undervaluation of 30%, and ± 10% for over or undervaluation of 50%. While I knew this approach did not account for important factors like opportunity cost, volatility, or correlation with the rest of the portfolio, I had never come across a formulaic way to determine the proper size of a position. So, a simple strategy based on valuation seemed appropriate. However, past performance suggested otherwise. I decided to search for a better way and eventually came across the Kelly Criterion. The Kelly Criterion is a mathematical formula that determines the ideal size of a bet to maximize the expected return over many iterations. Though largely associated with gambling, it can theoretically be applied to investing as well. However, in practice this can be problematic. Because, unlike gambling – where the odds are known and outcomes are discrete – investing involves a continuous range of potential outcomes with significant uncertainty. Yet despite these challenges, some investors have used the Kelly Criterion to outperform the market for many years.1 Thus, I explored the possibility of incorporating the formula into my strategy as well. After some research and a bit of trial and error, I eventually found a way to use the Kelly Criterion to effectively calculate optimal position sizes. The key was using a slightly modified version of the formula and carefully chosen assumptions about risk and return. This allowed me to incorporate not just valuation into my process, but also expected volatility and opportunity cost. Although this was a step in the right direction, there was more work to be done since my process still did not account for correlation with the rest of the portfolio – an important factor to consider when making multiple, simultaneous investments. And that’s when I realized that another formula used in mean-variance analysis could be used for this purpose. Unlike the Kelly Criterion, mean-variance analysis aims to maximize the return of a portfolio per unit of risk. In other words, it seeks to achieve the highest return possible with the least amount of volatility. Though this equation had always been presented as a way to calculate portfolio volatility, it occurred to me that it might also be useful as a tool for determining appropriate position sizing. So, after rearranging the formula to solve for portfolio weights, and using a bit of Microsoft Excel magic, I discovered how to determine optimal position sizes based on mean-variance analysis as well. And this utilized not just valuation, volatility, and opportunity cost, but also correlation. Though the Kelly Criterion and mean-variance analysis sometimes provided different results – since they optimize for expected return in slightly different ways – I could use the outputs from each of these methods as a guide for determining ideal position sizes at any time. The result was a slightly more complex but much more accurate and highly optimized strategy for position sizing.
Once I had a more effective system for determining position size, however, another question arose; when should I rebalance positions? This brought me to the second lesson learned:
Never buy or sell a stock based solely on position size. Again, my strategy for portfolio rebalancing had been simple; rebalance whenever a position became ± 6% outside of its optimal range. The stock didn’t have to be over or undervalued per se, just disproportionately weighted based on its valuation. But, after looking at the track record of these trades, it was clear that the portfolio would have been better served if I had just done nothing. That is, the extra trading was not adding to performance in any meaningful way (and in many cases was hurting it). Consequently, I resolved to rebalance a position only if it met three criteria:
It was a minimum of 6% below its optimal range, and…
It was trading below my “buy” price target, and…
There was excess cash in the portfolio or another stock that could be sold to offset the transaction (i.e., it also met criteria a. and b. but in the opposite direction)
OR…
It was a minimum of 6% above its optimal range, and…
It was trading above my “sell” price target, and…
There was a shortage of cash in the portfolio or another stock that could be bought to offset the transaction
The result is likely to be less frequent trading but higher expected returns and potentially less volatility. However, this led to another question. Should I hold excess cash or be fully invested? And this brought me to the third and final lesson learned:
Always hold some excess cash. I have always had a cash management strategy based on the overall valuation of the market. In general, this strategy has worked well. Though holding cash during a bull market was a drag on performance during the first few years of the fund, it was a huge benefit when the market fell at the end of 2018 and again at the beginning of 2020. Not only did the excess cash help Kehlet Capital outperform as the market declined but it also provided the opportunity to purchase stocks at attractive prices – which bolstered performance when the market eventually recovered. Therefore, holding excess cash has generally been a good thing – it’s not holding enough that has been the problem. For example, when the value of the portfolio declined at the end of 2021, I used much of the funds excess cash to add to some positions, even though it resulted in less cash than my strategy called for based on the overall valuation of the market. My thinking was that attractive buying opportunities don’t come around very often and it’s important to take advantage of them when they do. After all, that’s what the excess cash is for. But as the market continued to fall early in 2022 – and stocks became even more attractive – I had no “dry powder” left to be opportunistic. If I wanted to buy a stock, I needed to sell another one. But the entire portfolio was down and trading at attractive prices. So, I was stuck between a rock and hard place for quite some time. Though I was eventually able to raise the cash position at reasonable prices, the lesson was a painful one. As Warren Buffett has said “cash is like oxygen. When it’s abundant it goes unnoticed. But when it’s missing, it’s all that is noticed.”
Unfortunately, mistakes are an inevitable part of investing, and I will undoubtedly make more in the future. But I will always strive to keep them to a minimum and learn from them whenever possible. Though my mistakes have been disappointing, I believe I am a better investor because of them. And based on the changes I’ve made to the process and my conviction in the stocks in our portfolio, I’m optimistic that the next six years will be even better than the last.
Performance
During the fourth quarter of 2022, Kehlet Capital Management’s concentrated micro-cap composite increased 19.06%, outperforming the benchmark which grew 6.21%. For the full year 2022, Kehlet Capital Management’s concentrated micro-cap composite decreased 22.63%, compared to the benchmark which fell 20.48%.
Our largest contribution to performance for the quarter came from Bandwidth Inc. (BAND), which increased 92.79%. During the fourth quarter, the company reported its third quarter results which included a number of positive developments. First, revenue growth came in well ahead of expectations, increasing 13.5% year-over-year vs. 7.9% expected. Second, management’s forward guidance for the fourth quarter was strong, with revenue growth expected to increase to 16.5% year-over-year. Third, I noted last quarter that the company experienced its first ever sequential decline in the number of active customers in Q2, and that this trend would be important to keep an eye on going forward. But in Q3 Bandwidth showed improvement in this metric, increasing its active customer count by 0.5% quarter-over-quarter. And fourth, management announced that the company had reached an agreement with holders of its Convertible Senior Notes to repurchase $160 million in principal amount at approximately a 29% discount to par value. The importance of this agreement should not be understated as it essentially results in $45 million in free money for Bandwidth. How? Because less than three years ago, the company received $400 million from private investors in exchange for an IOU. But with this new agreement in place, Bandwidth is able to buy back $160 million of these IOU’s for the discounted price of approximately $115 million. It’s like borrowing $1,000 from the bank and then three years later the bank tells you, “I know you owe us $1,000 but if you pay us $710 right now, we’ll call it even.” I think most people would take that deal. And the net result for Bandwidth is $285 million in cash received but only $240 million in IOU’s outstanding. Needless to say, Bandwidth’s momentum seems to be improving and I believe the long-term thesis remains intact.
Our largest detractor to performance for the quarter was Tucows Inc. (TCX), which declined 9.34%. As a reminder, Tucows operates three businesses. First, it is the second largest domain name registrar in the world. Second, it is a provider of low-cost mobile telephone service through its Ting Mobile brand. And third, it is a provider of high-speed fiber internet access through its Ting Internet brand.
2022 was a year of heavy investment for the company, which caused significant disruption to the bottom line. For example, despite growing revenue by 9.2% through the first three quarters of the year, adjusted operating income fell by 74.2%. The reason for this is twofold. First, in late 2020 Tucows sold its Ting Mobile brand to DISH Network and transitioned the business from a Mobile Virtual Network Operator (MVNO) model to a Mobile Services Enabler (MSE) model. Simply put, instead of reselling mobile network capacity as an MVNO (like Boost Mobile or Cricket Wireless) the company decided to provide back-office functions – like planning, billing, and provisioning – to MVNO’s themselves. As part of this change, Tucows also launched a new telecom software business, called Wavelo, in early 2022, which helps simplify network operations and support. Though the company has used this software internally for years, it requires additional investment to get the business off the ground. As a result, the profitability of the company’s legacy Mobile business declined in 2022, despite an improvement in its prospects for future growth. Second, in 2022, Tucows significantly accelerated its buildout of the Ting fiber internet network in order to take advantage of the massive opportunity in front of them. In fact, the company increased its capital expenditures by roughly 50% – from just over $14 million per quarter in 2021 to nearly $21 million per quarter in 2022. Consequently, these investments have had a meaningful impact on bottom line results. However, the decline in profits should be of little concern to long-term investors because the investments being made are highly attractive. It will simply take time for them to come to fruition. But, based on the potential returns of these investments and management’s track record of exceptional capital allocation, I believe the long-term thesis remains intact.
Our largest contribution to performance for the full year 2022 came from Fonar Corp. (FONR), which increased 11.80%. Last quarter, I wrote about how, even assuming 0% growth, Fonar could still be an attractive investment and that higher growth was not only possible but likely. And in fiscal 2022, the company made progress on that front, growing revenue by 8.5% and adjusted operating income by 4.8% despite an ongoing shortage of qualified workers at some of its locations. Though fiscal 2023 got off to a slow start I believe the company’s latest investments in new facilities and equipment, as well as its recently announced share buyback program will allow it to continue growing at satisfactory rates for the foreseeable future. And given the stock’s valuation, I believe the thesis remains intact.
Our largest detractor to performance for the full year 2022 was Bandwidth Inc. (BAND), which declined 68.41%.
Portfolio Activity
No adjustments to portfolio weights were made during the quarter.
Conclusion
2022 was another difficult year in both absolute and relative terms. But the fourth quarter showed some positive momentum, which will hopefully carry over into next year. Either way, the last two years have taught me a lot, and I have used the lessons learned to fine-tune my investing process. Though the changes I’ve made have been small, I believe they will have a big impact on future performance. These changes, combined with the conviction I have in our portfolio companies, continues to give me excitement about the long-term potential for performance going forward. Thank you again for supporting Kehlet Capital Management, and please do not hesitate to contact me should you have any questions or comments.
| Number of holdings | 10 |
|---|---|
| Median market cap | $361M |
| Weighted avg. market cap | $385M |
| Fonar Corp. (FONR) | 28.3% |
|---|---|
| Bandwidth Inc. (BAND) | 16.8% |
| Climb Global Solutions (CLMB) | 15.3% |
Notes
- The most notable example is probably former hedge manager Edward O. Thorp, as chronicled in William Poundstone’s book “Fortune’s Formula” ↩
Disclosures to Performance Results
Actual composite performance results represent the performance of fully discretionary accounts managed by Kehlet Capital Management (KCM) during the corresponding time period. The composite performance results reflect time-weighted rates of return, the reinvestment of dividends and other account earnings. The reinvestment of dividends and other earnings may have a material impact on overall returns.
Past performance is not indicative of future results and the performance of a specific individual client account may vary substantially from the composite performance results. Therefore, no current or prospective client should assume that future performance will be profitable, or equal either the KCM composite performance results reflected above, or the performance results for any of the comparative index benchmarks provided.
For reasons including variances in portfolio account holdings, variances in the investment management fee incurred, market fluctuations, the date on which a client engages KCM’s investment management services, and any account contributions or withdrawals, the performance of a specific client’s account could vary substantially from the indicated KCM composite performance results. A portion of each account can be actively managed in an attempt to respond to changing conditions.
All performance results have been compiled solely by KCM, are unaudited, and have not been independently verified. Therefore, the performance data could be wrong. Information pertaining to KCM’s advisory operations, services, and fees is set forth in KCM’s current Form ADV Part 2A disclosure brochure, a copy of which is available from KCM upon request.
iShares IWM is an exchange-traded fund (ETF) measuring the performance of approximately 2,000 small-cap companies. It serves as a benchmark for small-cap stocks in the United States.
KCM managed accounts may own assets and follow investment strategies which cause them to differ materially from the composition and performance of the ETF shown as a benchmark. The ETF was chosen for its accessibility, transparency, independence, and relevance to KCM’s investment strategy, but there may be other indices that are more appropriate or applicable to the Concentrated Micro-cap Strategy. The historical index performance results are provided exclusively for comparison purposes only, so as to provide general comparative information to assist an individual client or prospective client in determining whether a specific Portfolio meets, or continues to meet, his/her investment objective(s). It should not be assumed that account holdings will correspond directly to any of the comparative indexes.
Different types of investments and/or investment strategies involve varying levels of risk, and there can be no assurance that any specific investment or investment strategy (including the investments purchased and/or investment strategies devised by KCM) will be either suitable or profitable for a client’s or prospective client’s portfolio and may result in a loss of principal. Accordingly, no client or prospective client should assume that the above portfolios (or any component thereof) serve as the receipt of, or a substitute for, personalized advice from KCM, or from any other investment professional.