
“Both poker and investing are games of incomplete information.”
“In both poker and investing, you can make the best possible decision at every turn… but still lose the hand or the trade because of luck or information you didn’t have access to.”
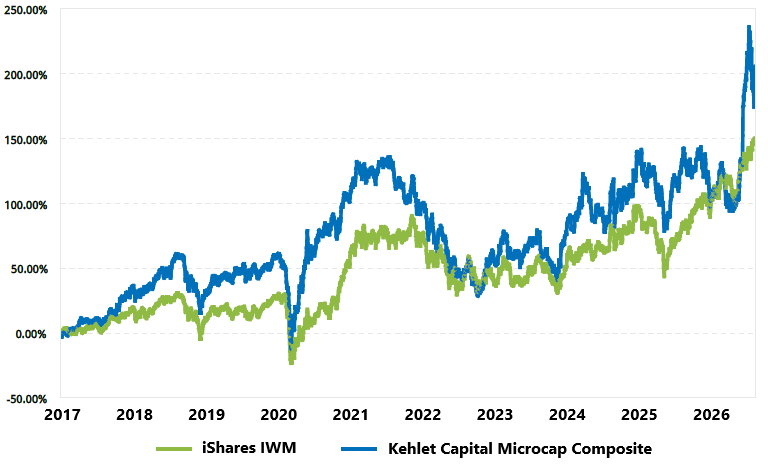
| Year | KCM Composite, Net | IWM | Excess Return |
|---|---|---|---|
| 2017* | 27.20% | 14.26% | +12.94% |
| 2018 | -3.43% | -11.11% | +7.68% |
| 2019 | 27.79% | 25.39% | +2.40% |
| 2020 | 27.52% | 20.03% | +7.49% |
| 2021 | -1.45% | 14.54% | -15.99% |
| 2022 | -22.63% | -20.48% | -2.15% |
| 2023 | 23.12% | 16.84% | +6.28% |
| 2024 | 15.29% | 11.39% | +3.90% |
| 2025 | -1.08% | 12.66% | -13.74% |
| YTD 2026 | 41.68% | 22.56% | +19.12% |
| Annualized | 12.52% | 10.23% | +2.29% |
*Inception date: 02/01/2017
Introduction
This past quarter, our largest position, Bandwidth Inc. (BAND), rose nearly 254%. What makes that worth pausing on isn’t just the size of the move. It’s that for roughly five years beforehand, the stock had gone nowhere while the market marched higher. If you’d checked in at almost any point along the way, you’d have seen a laggard. Then, in a single quarter, years of patience paid off all at once. That pattern – a long, frustrating stretch followed by a sudden leap – reminded me of something that has nothing to do with the stock market at all.
A few times a year, some friends and I sit down for a night of Texas Hold ’em. It’s low-stakes and mostly an excuse to catch up. People tend to lump poker in with games of pure chance, yet the best players aren’t the luckiest. They’re the most disciplined. They fold the large majority of the hands they’re dealt, waiting for the few worth betting on. And the more I play, the more I notice how the table teaches the same lessons the market does. Three of them stand out.
First, get comfortable with uncertainty. In Hold ’em, every decision is made with part of the picture hidden, and holding out for certainty simply isn’t an option. Investing is no different. No matter how much research I do, I can’t know what the economy, management teams, or other investors will do next. Uncertainty isn’t something to be eliminated; it’s the price of admission. The goal is to reduce that uncertainty as much as research allows, then size each position accordingly.
Second, separate the process from the outcome. You can play a hand flawlessly and lose it, or botch one and win. One result says very little about the quality of the decision behind it. Markets behave the same way over short stretches: sound decisions can look foolish for a while, and lucky ones can look brilliant. I’d rather keep making good decisions and let the odds work over time than chase whatever worked in the last hand.
Third, stay in the game. Poker and years of investing taught me this one, and Bandwidth reminded me of it this quarter. Progress doesn’t arrive on a schedule. Much of poker is patient folding while your stack slowly shrinks, and then the cards break your way and one hand erases hours of grinding. Owning small, under-followed companies generally feels the same: a position can sit idle, or drift lower, for a long time before the market suddenly catches on. Bandwidth was the long fold; this past quarter was the pot. I won’t pretend one quarter proves the thesis. But those sudden leaps are where much of the return tends to come from, and you only collect them if you’re still at the table when they happen.
With those lessons in mind, let me turn from the card table to the portfolio: how the market looks, how we performed this quarter, and the moves I made.
Market Valuation
For readers interested in where the overall market stands from a valuation perspective, I present the following two charts based on KCM analysis:
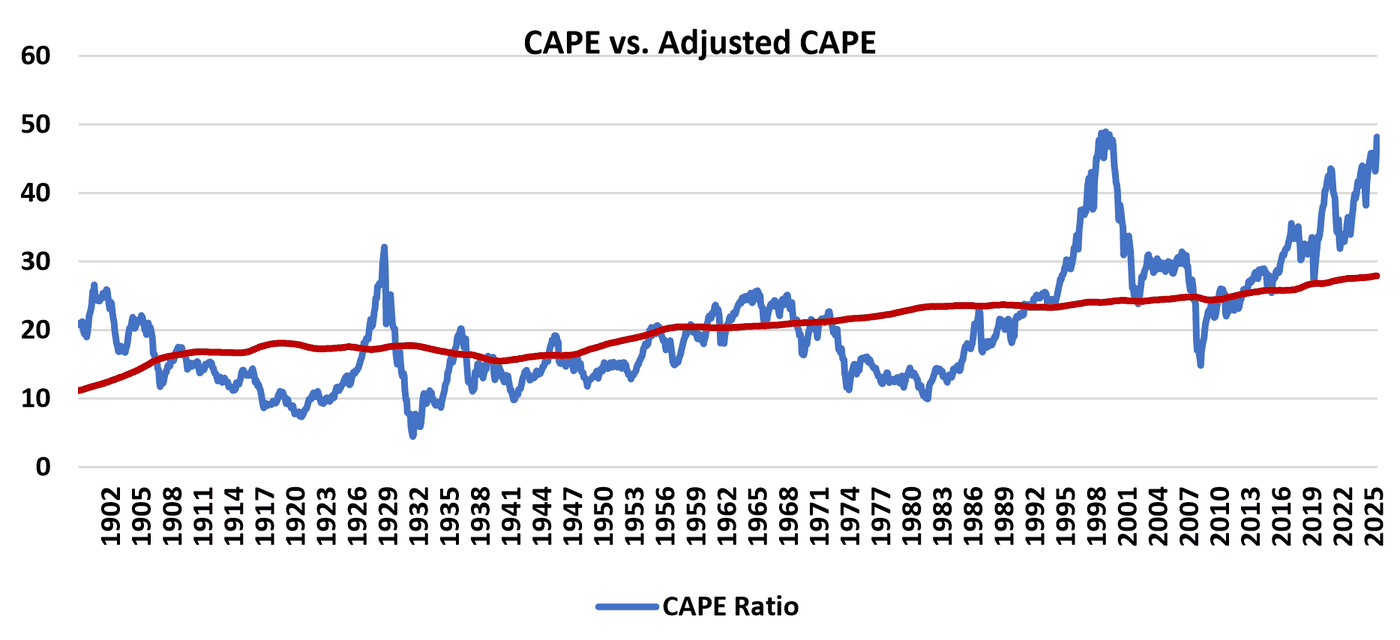
In the first chart, the blue line is the CAPE ratio (the cyclically adjusted price-to-earnings ratio, which compares prices to average earnings over the past decade), and the red line is my estimate of fair value based on historical averages of interest rates, equity risk premiums, and corporate earnings growth.
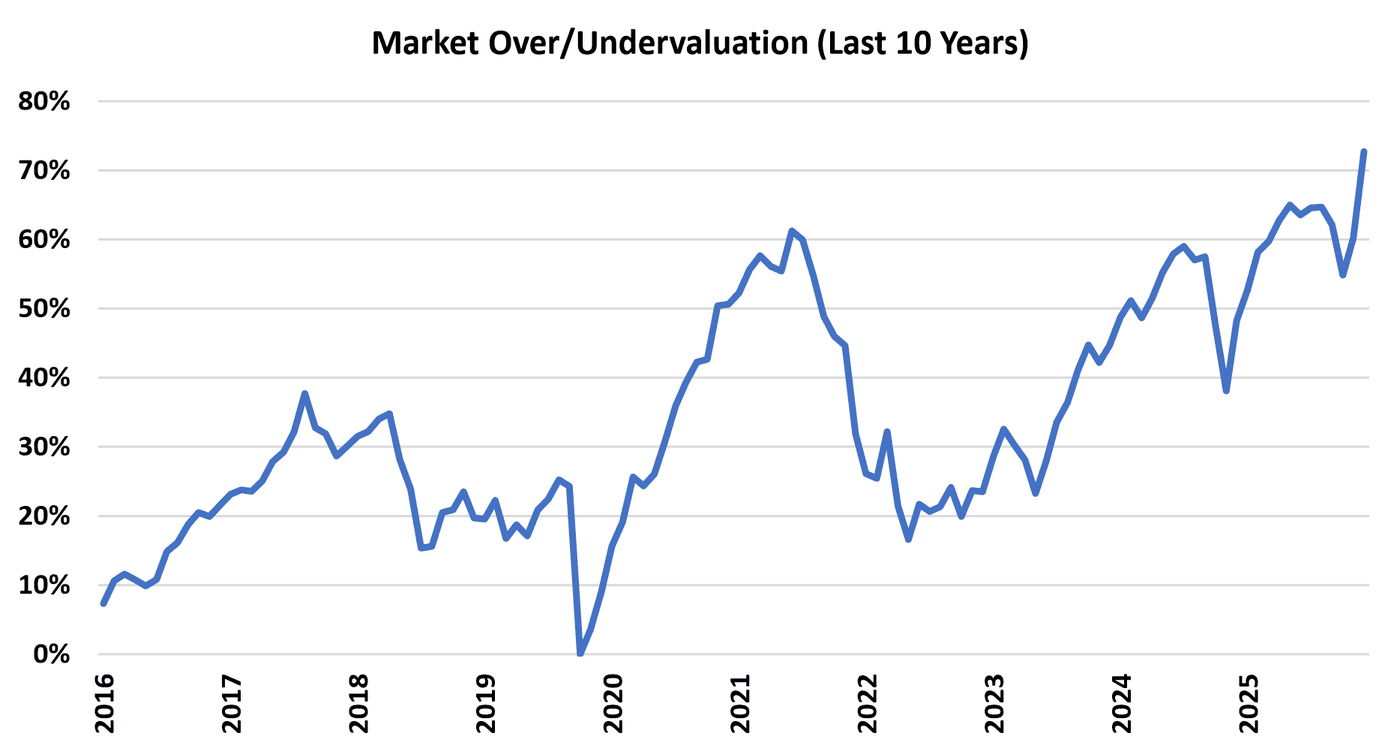
The second chart shows how over- or undervalued the market has been relative to that fair-value estimate over the last ten years. Both point to the same conclusion: the market remains at historically elevated levels, and valuations expanded further during the second quarter.
Performance
During the second quarter of 2026, Kehlet Capital Management’s concentrated micro-cap composite increased by 50.86%, outperforming the benchmark, which rose by 21.44%.
Our largest contributor to second-quarter performance was Bandwidth Inc. (BAND), which increased 253.91%. The move began on April 30, when Bandwidth reported record first quarter revenue of $209 million, up 20% from a year earlier, and raised its guidance for the rest of the year. More important than any single number was the reason behind the growth. Bandwidth has positioned itself as the communications network behind artificial intelligence, providing the phone connections that AI “voice agents” use to handle calls for large companies. That story gained steam as the quarter progressed. In late June, the company introduced Bandwidth Build, which lets AI agents connect to its network automatically, adding to an existing deal to power Salesforce’s new AI-driven contact center. It also refinanced debt on favorable terms. After years of the stock going nowhere, the market finally recognized what had been developing in plain sight, and the thesis remains intact.
Our largest detractor to performance was Tucows Inc. (TCX), which declined 21.62%. The decline followed the company’s first-quarter report, released May 7. Revenue rose 2% year-over-year to $96.7 million, but the net loss widened to $18.1 million from $15.1 million a year earlier, and adjusted EBITDA, a measure of operating profitability, fell 15% to $11.7 million. The bigger concern was Tucows’ fiber-internet business, Ting. Management disclosed that Ting was burning through cash and might not be able to meet its obligations over the coming year without raising additional money. In response, the company launched a review of strategic alternatives, including a potential sale, acknowledging that Tucows may not be the business’s best long-term owner. Investors worried about the cash Ting had already consumed and the uncertainty around a sale, and the stock drifted lower through the quarter. That said, Tucows’ other two businesses, its domain-name operation and its telecom software platform (Wavelo), remain solidly profitable, and I still see real value in Ting itself. The question is not whether Ting is worth owning, but whether Tucows can finance its buildout. I am reassessing the position as the review plays out, but I am comfortable being patient while it gets resolved.
Portfolio Activity
During the quarter, I sold our position in Fonar Corp. (FONR). In late December 2025, the company agreed to be taken private by an investor group led by its own management at $19.00 per share. After shareholders approved the deal on May 28, I sold our shares in the open market at about $19.06, just above the buyout price, rather than wait for the transaction to close on June 3. Over the 6.5 years we owned Fonar, it returned an average of just 0.40% per year, compared with 11.20% for the benchmark. It was, frankly, one of our more disappointing holdings.
I redeployed the proceeds into Strategy Variable Rate Perpetual Stretch Preferred Shares Series A (STRC). Like the SATA preferred I described last quarter, STRC is essentially an alternative to cash: a perpetual preferred stock (it never matures and sits ahead of common shares for dividends) with a $100 stated value that pays a variable monthly dividend, which the issuer adjusts up or down to keep the price near $100. It is issued by Strategy, formerly MicroStrategy, whose balance sheet is backed by Bitcoin. I bought our shares at just under $88, where the $11.50 annual dividend worked out to an effective yield of more than 13%, and shortly after, the company raised the dividend to $12. For a portion of the portfolio I would otherwise hold in cash, it offers a higher yield while I wait for the next opportunity. Though it does carry more risk than cash – since its value is tied to Strategy’s Bitcoin-backed balance sheet – I believe the risk is well worth the reward.
Turning to an update from last quarter, the new position I mentioned is Addus HomeCare Corp. (ADUS). Addus is one of the country’s larger providers of home-based care, helping elderly, chronically ill, and disabled people with the tasks of daily living so they can stay in their own homes rather than move to a hospital or nursing facility. It serves roughly 63,000 patients across 24 states through three business lines: personal care, which is about three-quarters of revenue, along with hospice and home health.
The investment case is straightforward. The country is aging, and demand for in-home care is growing steadily as a result. Home care is also far less expensive than a hospital or nursing home, so the government programs that pay for most of it have every reason to keep steering patients toward it. The industry is highly fragmented, which lets Addus grow both on its own and by acquiring smaller local operators, as it did again this quarter with a home-care business in Indiana. It should also prove insulated from disruption from artificial intelligence. Caring for an elderly or disabled person in their home is hands-on work that software cannot replicate. While AI is reshaping many businesses today, it is unlikely to reduce demand for what Addus does. The result is a durable, recession-resistant company that has grown revenue and earnings consistently for years. The main risk is its dependence on government reimbursement rates, which can shift with budgets and politics. However, at the price I paid, I believe the upside more than makes up for the risk.
Conclusion
The second quarter of 2026 was a strong one by any measure. Our composite returned 50.86%, well ahead of the benchmark’s 21.44%, driven largely by a long-awaited rebound in Bandwidth. I am pleased with the result, but mindful that no single quarter, good or bad, says much about a strategy built for the long run. I will keep doing what I always have: concentrating on a handful of high-quality, undervalued businesses and giving them room to work. Thank you for your continued confidence in Kehlet Capital Management. As always, I welcome your questions and am happy to discuss the portfolio anytime.
| Equity holdings | 6 |
|---|---|
| Median market cap | $1,084M |
| Weighted avg. market cap | $1,096M |
| Bandwidth Inc. (BAND) | 43.8% |
|---|---|
| Climb Global Solutions (CLMB) | 9.3% |
| Strive Inc. (ASST) | 6.1% |
Disclosures to Performance Results
Actual composite performance results represent the performance of fully discretionary accounts managed by Kehlet Capital Management (KCM) during the corresponding time period. The composite performance results reflect time-weighted rates of return, the reinvestment of dividends and other account earnings. The reinvestment of dividends and other earnings may have a material impact on overall returns.
Past performance is not indicative of future results and the performance of a specific individual client account may vary substantially from the composite performance results. Therefore, no current or prospective client should assume that future performance will be profitable, or equal either the KCM composite performance results reflected above, or the performance results for any of the comparative index benchmarks provided.
For reasons including variances in portfolio account holdings, variances in the investment management fee incurred, market fluctuations, the date on which a client engages KCM’s investment management services, and any account contributions or withdrawals, the performance of a specific client’s account could vary substantially from the indicated KCM composite performance results. A portion of each account can be actively managed in an attempt to respond to changing conditions.
All performance results have been compiled solely by KCM, are unaudited, and have not been independently verified. Therefore, the performance data could be wrong. Information pertaining to KCM’s advisory operations, services, and fees is set forth in KCM’s current Form ADV Part 2A disclosure brochure, a copy of which is available from KCM upon request.
iShares IWM is an exchange-traded fund (ETF) measuring the performance of approximately 2,000 small-cap companies. It serves as a benchmark for small-cap stocks in the United States.
KCM managed accounts may own assets and follow investment strategies which cause them to differ materially from the composition and performance of the ETF shown as a benchmark. The ETF was chosen for its accessibility, transparency, independence, and relevance to KCM’s investment strategy, but there may be other indices that are more appropriate or applicable to the Concentrated Micro-cap Strategy. The historical index performance results are provided exclusively for comparison purposes only, so as to provide general comparative information to assist an individual client or prospective client in determining whether a specific Portfolio meets, or continues to meet, his/her investment objective(s). It should not be assumed that account holdings will correspond directly to any of the comparative indexes.
Different types of investments and/or investment strategies involve varying levels of risk, and there can be no assurance that any specific investment or investment strategy (including the investments purchased and/or investment strategies devised by KCM) will be either suitable or profitable for a client’s or prospective client’s portfolio and may result in a loss of principal. Accordingly, no client or prospective client should assume that the above portfolios (or any component thereof) serve as the receipt of, or a substitute for, personalized advice from KCM, or from any other investment professional.