
“If you don’t have a competitive advantage, don’t compete.”
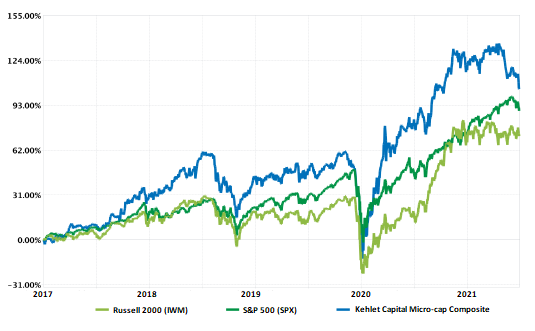
| Year | KCM Composite, Net | IWM | Excess Return |
|---|---|---|---|
| 2017* | 27.20% | 14.26% | +12.94% |
| 2018 | -3.43% | -11.11% | +7.68% |
| 2019 | 27.79% | 25.39% | +2.40% |
| 2020 | 27.52% | 20.03% | +7.49% |
| YTD 2021 | 1.29% | 12.29% | -11.00% |
| Annualized | 16.36% | 12.29% | +4.07% |
*Inception date: 02/01/2017
Introduction
In last quarters newsletter I talked about the importance of return on invested capital (ROIC), how it’s calculated, and how it’s impacted by Porter’s 5 Forces. I then used these concepts to introduce my framework for analyzing the potential profitability of a business. In this newsletter I’ll build upon this framework, add a few new forces to the mix, and suggest ways to gauge the strength of each force. Finally, I will show how my profitability framework fits within the previously discussed Dupont analysis for ROIC in order to help long-term investors recognize businesses capable of earning high returns on invested capital over time.
As a reminder, the initial framework looked like this:
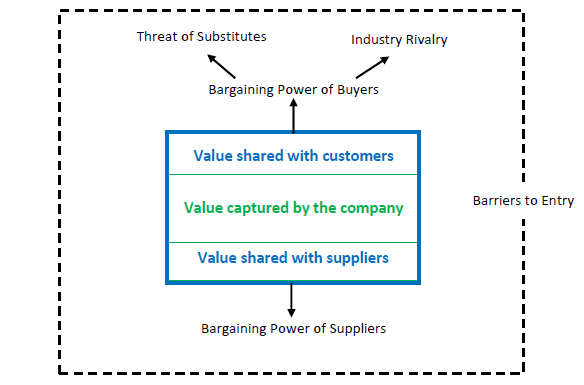
The basic concept of the diagram above is that the amount of value created by a company’s product or service minus the value it shares with customers and suppliers determines its profitability. And the two primary factors that determine how much value will be shared with customers and suppliers are buyer power and supplier power. That is, the more negotiating leverage a businesses’ customers or suppliers have, the less value it will retain for itself. You can visualize this dynamic by imagining the blue boxes labeled “value shared with customers” and “value shared with suppliers” growing bigger with increasing buyer power or supplier power, and the green box labeled “value captured by the company” shrinking proportionately. Meanwhile the size of the entire box, representing the total value created, would remain the same. But it’s this constant push and pull between a business, its customers and suppliers that ultimately determines how profitable it will be. Therefore, assessing the relative strength of buyer power and supplier power is critical to analyzing a company’s profitability potential.
But what determines the strength of each factor? In my experience, they are governed by several other sub-forces. We’ve already identified two – the threat of substitutes and industry rivalry – using Porter’s 5 Forces, as shown in figure 1. If we combine these two forces into one called “adequate alternatives” and add a few more of our own, we end up with four primary determinants of bargaining power. They are:
Adequate alternatives – Adequate alternatives exist when a potential customer has various suitable options to choose from when deciding where to purchase a product or service. The more alternatives that exist, the more value a company will need to offer to attract customers. For example, let’s say you pass by multiple gas stations on your way home from work. If the gasoline at one station is priced too high, you might decide to stop at a different gas station along your route. If enough other drivers do the same thing, this high-priced gas station will lose business and eventually be forced to reduce its price. In other words, the presence of adequate alternatives gives consumers meaningful power to “negotiate” price. It’s important to note that the term bargaining power does not always refer to the negotiating leverage of an individual customer. More often it refers to the power of a group of customers who “vote” for lower prices by taking their business elsewhere. And this is where the concept of industry rivalry, mentioned earlier, comes in to play. Because the more aggressively a gas station lowers its price to attract new customers, the more its competitors are forced to respond to remain an appealing option for drivers. Moreover, substitutes can also provide customers with adequate alternatives. For instance, instead of driving to work every day you might opt to ride your bike, carpool with coworkers, or even work from home. All these options reduce your overall need for gasoline and thus increase your relative bargaining power with gas stations. As a result, it is critical that a business differentiates itself to reduce the adequate alternatives in the market, decrease the bargaining power of its customers, and increase profitability. Take Tucows Inc. (TCX) for instance, a portfolio company that provides fiber optic internet to the home. When Tucows (operating under the name Ting Internet) first installs fiber optic cable to a neighborhood, it becomes the only provider of fiber internet to those residents. Although homeowners still have alternative options (i.e., substitutes) in the form of slower cable or DSL internet, if they want high-speed, low latency service, Ting is their only choice. As such, the lack of adequate alternatives allows the company to charge a premium price and earn high operating margins at scale.
Switching costs – Switching costs refer to the costs an existing customer incurs from switching to another provider compared to the incremental benefits they receive. They are often the result of one of the following three circumstances:
A product or service that is slow and expensive to implement – Let’s say you just purchased a software program that helps you file your taxes. The software is complex, so it takes several weeks to learn the program and several more to load your financial information into the system. The following year around tax time you notice a new software program offered by a competitor for slightly less money. You have two options. 1) You can switch to the competing software and spend over a month of your precious time going through the implementation process all over again, or 2) you can continue to pay a slightly higher price for the software you’re already familiar with and that has your information preloaded. In most cases, you’re likely to go with option 2) because the cost of option 1) is simply too high.
A customer that is highly risk averse – Risk aversion is typical for businesses that provide products with an unacceptably high cost of failure, such as the loss of human life. This dynamic is most common in the aerospace and healthcare industries. For example, if an airline switches from their regular supplier of aftermarket jet engine parts to an unproven new supplier, they may benefit by saving a few dollars per part but at the risk of disaster should a component fail mid-flight. In most cases the risk (i.e., switching cost) outweighs the reward for these airlines. It should also be noted that this hurdle can be overcome through extensive testing and validation prior to making a switch. But that creates an even slower and more expensive implementation process, which increases switching costs even further.
Low switching benefits – Low switching benefits occur when the switching costs are minimal, but the incremental benefits of that switch are even smaller. Take a bank account, for example. The switching costs of moving a checking account from one bank to the next is fairly low, but the benefit of that move is likely negligible. Therefore, many people maintain accounts with their banks for years or even decades, despite the very low cost of switching. However, if a product or service has low switching benefits, it is, by definition, a commodity and unlikely to earn high margins. (It can still generate high returns on invested capital if it is either asset-light or capital-light, but that is a topic for next quarter’s newsletter.)
In sum, switching costs can significantly reduce the buying power of customers and help drive strong profitability. Chase Corp. (CCF) is an example of one portfolio company that benefits from high switching costs. Chase provides specialty chemicals to automotive and industrial original equipment manufacturers (OEM’s). Specialty chemicals are essentially molecular “recipes”, each with its own unique properties, such as heat resistance, viscosity, permeability, density, and weight. And Chase’s OEM customers use these specialty chemicals within their manufacturing processes to protect and enhance their own products. If an OEM were to switch out one specialty chemical to another, it would likely end up with a slightly different chemical “recipe” with slightly different properties. But for large manufacturers with processes optimized for specific inputs, this change can lead to enormous switching costs. Because even minor adjustments can result in major unforeseen problems. Additionally, since Chase’s specialty chemicals are used to enhance the properties of its customers finished product, a change in “recipe” could also have unintended consequences on product quality and performance. This risk further increases switching costs, reduces customer bargaining power, and helps Chase consistently achieve operating margins above 20%.
Price sensitivity – Price sensitivity refers to a customer’s relative desire to seek a better price. This is typically motivated by a product or service that costs a lot relative to the customer’s annual income. In other words, if I want to buy a new car, the transaction is likely to represent a large portion of my yearly income. As a result, I am probably going to be highly sensitive to price and try to negotiate the best deal. Though price sensitivity doesn’t necessarily give me more bargaining power, it does make me more willing to bargain in the first place. The flip side of this is price insensitivity. That is, for certain products and services customers are generally willing to tolerate price increases. This can be the result of two main factors:
A low purchase price relative to the value received – For example, gasoline is only a few dollars per gallon – easily affordable for most people – but provides enormous value by making transportation possible. As a result, drivers tend to tolerate price increases (begrudgingly) when they happen. The astute reader may wonder “if people are so insensitive to the price of gasoline, why are gas retailer’s margins so low?” The answer is that gasoline is a commodity with numerous adequate alternatives, which increases a customer’s bargaining power more than the decrease from price insensitivity. Therefore, product differentiation is a prerequisite for producing high margins.
Information asymmetry – Information asymmetry is when one side of a transaction – generally the buyer – has less information than the other side – generally the seller. For example, most patients trust that their doctor knows significantly more than they do about their diagnosis and potential treatment options. As a result, they tend to opt for the doctor recommended treatment, rather than the most cost-effective one. In fact, most patients couldn’t select the most cost-effective treatment if they wanted to due to the lack of price transparency in the healthcare industry. This adds to the information asymmetry, which in turn decreases buyer power.
Consequently, price insensitivity (along with product differentiation) can help a business reduce buyer power and earn high profit margins. LeMaitre Vascular (LMAT), a portfolio company that provides vascular surgeons with medical devices for vascular surgery, is one example of this. Since the company’s products represent a tiny percentage of the overall cost of a surgery, vascular surgeons tend to be fairly price insensitive and purchase devices they are proficient with and can provide better health outcomes, rather than the cheapest. And this price insensitivity helps LeMaitre consistently earn operating margins above 20%.
Customer concentration – Customer concentration is the mirror image of price sensitivity and refers to a supplier’s relative motivation to offer a better price. It occurs when one or a handful of customers represents a sizeable portion of a company’s total revenue. For instance, let’s say I wanted to buy a painting from a local artist. The artist is relatively unknown and typically sells about ten paintings a year. If the artist’s only source of income comes from selling paintings, a single piece of art could represent a substantial portion of their earnings. Consequently, they might be highly motivated to bargain with me rather than risk losing a sale. Fortunately for us, virtually all our portfolio companies have a diversified (rather than concentrated) customer base. Astronics Corp. (ATRO), a supplier of various aerospace components, may be the most susceptible to customer concentration, with 20% – 30% of its consolidated sales coming from just two customers – Boeing and Panasonic. However, Astronics benefits from other advantages, which I will talk about later, that mitigate this risk.
In my experience, buyer power and supplier power are best evaluated using these four forces. Although I’ve primarily used buyer power in the examples above, the analysis of supplier power is the same but in reverse. That is, the company is no longer the supplier to a customer but rather the customer to a supplier.
By using the analysis described above we can reasonably assess a company’s ability to generate profits for its shareholders. But the question then becomes “how sustainable is that profitability over time?” That is where the final piece of the puzzle comes in – barriers to entry. Barriers to entry are factors that inhibit new or existing competitors from entering a company’s particular market segment or niche. They are important for sustained profitability because without them, high levels of profitability will attract new competitors who will need to offer lower prices to entice customers until all the excess returns have been competed away. Therefore, barriers to entry are necessary for sustained profitability. According to the investment research firm Morningstar, there are five sources of competitive moat (i.e., barriers to entry):
Intangible assets – Intangible assets are assets, like intellectual property, brand recognition, and exclusive government licenses, that cannot be physically touched but still help protect a company from competition. For example, the brand strength of Callaway Golf (ELY), and its main competitors – Titleist, Ping, and TaylorMade – create sizable barriers to entry for new industry participants. As evidence, Nike, which attempted to enter the golf equipment business for nearly 20 years, was unable to gain more than single-digit market share before exiting the business in 2016. This failure was despite having a recognizable brand, significant financial resources, and the #1 golfers in the world – Tiger Woods and Rory McIlroy – under sponsorship for two decades. So, why did it fail? In short, because the brand value of established golf companies was too strong. Nike’s brand was unproven within golf and the business struggled to convince avid golfers to switch equipment. The takeaway? Intangible assets can create significant barriers to entry. Because if a company like Nike can’t successfully enter the golf equipment market, few, if any, other companies can either.
Efficient scale – Efficient scale occurs when a business can service a large portion of a market more efficiently than new or existing competitors. It often results from obtaining a very high percentage of market share on a local or narrowly defined basis. For example, imagine a community with two separate trash collection companies, “That’s Rubbish!” and “You’ve Got Trash.” Let’s say That’s Rubbish! counts 80% of the residents in a particular community as customers, while You’ve Got Trash has the remaining 20%. Even though You’ve Got Trash has fewer customers, its residents are scattered across the same geographic footprint. In other words, the company will have very similar fuel and labor costs as That’s Rubbish! but generate a fraction of the revenue. Thus, That’s Rubbish!’s route density gives it lower costs on a per customer basis. And lower costs mean that any attempt by You’ve Got Trash or any new competitor to lower prices, can easily be matched or surpassed by That’s Rubbish!, resulting in a sustainable competitive advantage. Astronics Corp. (ATRO) is another example of this. It has roughly 90% share of the in-seat power market for commercial aircraft. Consequently, the company has low fixed costs per unit and can easily match any competitor’s prices while maintaining superior margins. As such, the company benefits from meaningful barriers to entry.
Network effects – Network effects occur when a product or service becomes more valuable with each additional customer. Simply put, the more customers that sign up for a service the more valuable it becomes to existing customers. And the more valuable the service becomes to existing customers the more new customers that sign up – generating a virtuous cycle of growth and value creation. For instance, Care.com, an app that connects families with caregivers in their area (and a stock we previously owned), is a business that benefits from network effects. That is, the more families that sign up for Care.com, the more attractive the app becomes for caregivers looking for work. And the more caregivers that are available, the more valuable the service becomes for families seeking care. This network effect creates a substantial barrier to entry for would-be competitors. Because new entrants, who must build their networks from scratch, are unable to compete with the strength of Care.com’s network.
Switching costs – As described earlier, switching costs refer to the level of difficulty an existing customer has switching to another provider. Not only do they help a business increase profitability but they also make it difficult for new or existing competitors to steal customers away, thus providing established companies with a sustainable competitive advantage. Astronics Corp. (ATRO) is also an example of a business that benefits from switching costs. To understand why, imagine an airline that uses Astronics equipment to offer in-seat power to its first-class customers. If that airline then decides to start offering in-seat power to all its passengers, it has a choice to make. It can keep the maintenance, operations, and inventory of the aircraft simple and consistent by purchasing the additional units through Astronics, or it can add layers of complexity to its operation by choosing a new (likely unproven and higher-priced) supplier. For most airlines the choice is obvious. Now imagine that same airline uses Astronics to provide in-seat power to 40% of their fleet but wants to install it on the remaining 60%. They have the same decision to make with likely the same outcome. Simply put, customers who already use Astronics are likely to continue using them due to the high cost of switching to another supplier. This, combined with the company’s efficient scale mentioned earlier, creates substantial competitive advantages, and helps mitigate the company’s customer concentration risk.
Cost advantages – Cost advantages are just as the name implies, advantages due to lower costs. Similar to efficient scale, which generally produces lower fixed costs per unit, cost advantages typically result from having access to lower variable costs such as raw materials or labor. For example, the Saudi Arabian oil company, Saudi Aramco, owns the rights to highly attractive oil reserves, containing high-quality oil that costs little to extract and refine. Since few, if any, other companies have access to similarly high-quality, low-cost oil, Saudi Aramco has a sizeable and sustainable competitive advantage. However, in my experience this advantage is rare to find outside of commoditized industries. As a result, none of the companies in our portfolio benefit from this advantage.
And these five elements help determine whether a business can sustain its profitability over time. Now, with these additional factors in mind, we can update the previous framework as follows:
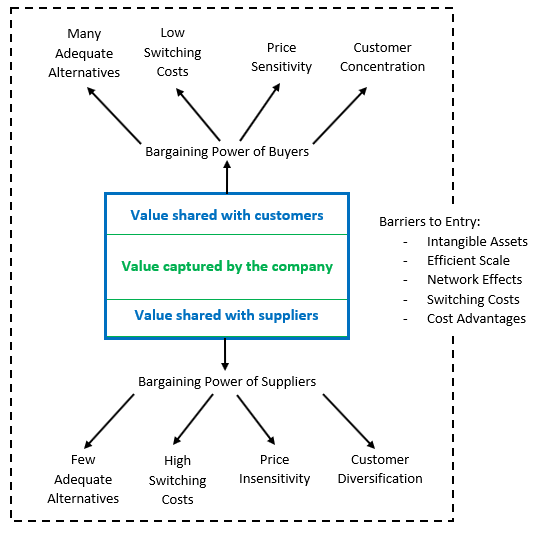
But the question remains, “how does one objectively gauge the strength of each force?” Admittedly, not all of them can be quantified but for the ones that can, I will do my best to provide metrics:
Adequate alternatives – Assessing the adequate alternatives in a market is, in essence, an attempt to gauge the relative commoditization or differentiation of a product or service. In my opinion it is best measured in two ways. First is by the change in market share. That is, if a company’s market share is increasing, then it is likely differentiated. If market share is decreasing, it is likely becoming commoditized. The second measure is the change in margins. If margins are declining over time, it might imply that a company is being forced to provide ever expanding price concessions to offset the commoditization of its offering. One note of caution, however; a drop in margins could mean that a company expects to gain market share and is investing in future growth. Therefore, this metric is best studied in combination with market share. It is also important to note that this analysis is forward looking. As such, it is not the absolute level of market share or margin that matters, but rather the rate of change.
Switching costs – Switching costs are best measured as the difference between the value gained by switching providers and the cost of switching. However, putting this into practice is generally quite difficult since value can be abstract and differ from one customer to the next. As a result, switching costs are frequently analyzed qualitatively.
Price sensitivity – Price sensitivity can typically be calculated as the purchase price divided by a customer’s annual income or revenue. The higher the percentage the more price sensitive a customer is likely to be.
Price insensitivity – Price insensitivity can be quantified as the purchase price divided by the value received. However, as mentioned earlier, value can be an abstract concept and thus difficult to gauge.
Customer concentration – Customer concentration can often be measured as the percentage of a company’s revenue generated by one or a few customers. The more diversified a company’s customer base, the less bargaining power its customers have.
Barriers to entry – Barriers to entry can generally be determined by the level of fragmentation within an industry. That is, if there are a significant number of competitors in a particular market segment, then there are likely few, if any, barriers to entry. But if there are only a handful of meaningful competitors in that segment, barriers to entry are likely significant.
These metrics can help an investor evaluate the relative strength of each of the forces impacting profitability. However, it’s important to note that they are not replacements for qualitative analysis but rather compliments to it. They are best used to confirm or deny the accuracy of a qualitative assessment of a business and should not be considered in a silo.
It is the total analysis described above that I use to assess the long-term profitability potential of a business. But remember, profitability (i.e., margin) is just one component of return on invested capital. Therefore, an expanded version of the framework should include the other two components as follows:
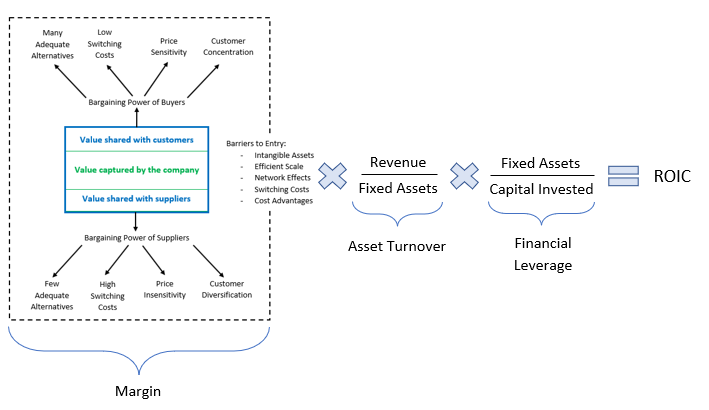
And in next quarters newsletter I will briefly describe these two elements of ROIC – asset turnover and financial leverage – and discuss how the analysis of company management fits within the above framework. Stay tuned…
Performance
During the third quarter of 2021, Kehlet Capital Management’s concentrated micro-cap composite decreased 12.67%, significantly underperforming the benchmark which fell 4.34%.
Our largest contribution to performance came from a new position initiated in the fourth quarter of 2020, Iradimed Corp. (IRMD), which returned 14.26% this quarter. Iradimed is a medical device company that manufactures the only non-magnetic, portable intravenous (IV) infusion pump and patient monitor specifically designed for use during MRI’s. To see why these products are important, it is critical to understand the current process for taking a patient to get an MRI. First, the patient is disconnected from their bedside vital signs monitor and then either reconnected to a portable monitor or transported to the MRI unmonitored. Once the patient arrives at the MRI they are disconnected from the portable monitor (if they have one) and reconnected to a large MRI monitor. Finally, multiple segments of IV tubing are strung together, threaded under the door or through the wall, and connected to an IV pump outside the MRI room. But this cumbersome process presents a number of issues. First, a patient in critical care can be at increased risk of an adverse event if unmonitored while going to and from the MRI. Second, the process of stringing multiple IV tubes together and changing over vital signs monitors several times creates additional workloads for hospital staff. Third, there is risk of a ferromagnetic IV pump or patient monitor being accidently brought into the MRI room and becoming a dangerous projectile, which can cause serious injury, and in some cases, death. And fourth, the use of long IV lines can result in occlusion alarms being delayed by up to 35 minutes, putting the patient at further risk. As one nurse I spoke to put it:
“It’s a huge process… Most pumps aren’t MRI safe, so we have to prime about 10 – 12 ft of tubing so the pumps can stay outside of the MRI suite when the patient goes in. It’s such a pain in the ass, especially when they are unstable and on large amounts of continuous drips. Same with the monitor. We have to disconnect then connect to the MRI safe monitor inside the room which can be dicey if a patient has a breathing tube.”
In contrast, Iradimed’s non-magnetic, portable IV pump and patient monitor faces none of these issues, and significantly improves patient safety and MRI workflows. As a result, the company organically grew revenue at over 25% annualized during the pre-COVID era from 2012 – 2019.
The thesis around Iradimed is threefold. First, the company’s products have few, if any, adequate alternatives. In fact, as the only provider of non-magnetic, portable IV pumps and patient monitors, Iradimed’s most significant competition comes from “workarounds” as described above. While these workarounds certainly provide hospitals with alternatives, they are far from “adequate”. Given this limited competition, Iradimed has the potential to earn substantial margins.
Second, the company benefits from strong intellectual property, which provides the business with barriers to entry and keeps would-be competitors at bay. Not only does Iradimed own nearly 20 patents covering its IV pump and patient monitor – with several more patents pending – but they have also developed meaningful trade secrets related to the engineering and design of their devices. And these competitive advantages provide the company with substantial barriers to entry and the opportunity to maintain profit margins over the long term.
And third, Iradimed has a strong management team led by founder and CEO Roger Susi. Mr. Susi is a biomedical engineer who founded Invivo Research Inc. in 1979, a company that pioneered the world’s first and best-selling MRI patient vital signs monitoring brand and was eventually acquired by Philips. Described to me as the “consummate tinkerer”, Mr. Susi has pioneered a number of important innovations throughout his career, including the first ever MRI compatible patient monitor in 1987, the first wireless MRI monitor in 1996, the first MRI infusion pump in 2005, and the first ever portable MRI patient monitor in 2016. Given this track record, I believe Iradimed will continue to innovate under his leadership and drive significant shareholder value over the long-term.
The largest detractor to performance was Bandwidth Inc. (BAND), which declined 34.54%. During the third quarter Bandwidth reported its second quarter financial results, which were well ahead of analyst expectations. They included revenue growth of 57.1% and non-GAAP EPS growth of 146.2%. In addition, management significantly increased its guidance for full year revenue and profitability. But despite these outstanding results, the stock continued its inexplicable decline, falling nearly 36% from the date of earnings until the time of this writing. In the first quarter I wrote that I believed the markets fear of inflation was hurting Bandwidth’s stock performance – at the time, the 10-year Treasury rate (which theoretically incorporates inflation expectations) had nearly doubled, from 0.93% at the beginning of 2021 to 1.74% by the end of the first quarter. And I still believe that to be the case. However, the declines in Bandwidth’s stock price since then are unlikely related to inflation. Why? Because 1) Treasury rates have fallen since the end of the first quarter – from 1.74% to 1.54% at the time of this writing – suggesting inflation fears have eased somewhat and, 2) Bandwidth’s closest competitor, Twilio (TWLO), which is subject to the same (or arguably greater) risk of inflation, has not seen a similar decline in stock price. In fact, over the last twelve months, Bandwidth’s stock has decreased over 53%, while Twilio’s has increased by nearly 9%. Therefore, I’m led to believe that Bandwidth’s struggles are specific to the company. So, what do I think is causing the underperformance? My best guess is a misunderstanding by the market of the company’s organic growth. For instance, if we chart Bandwidth’s organic CPaaS revenue growth since the first quarter of 2019 it looks like this:
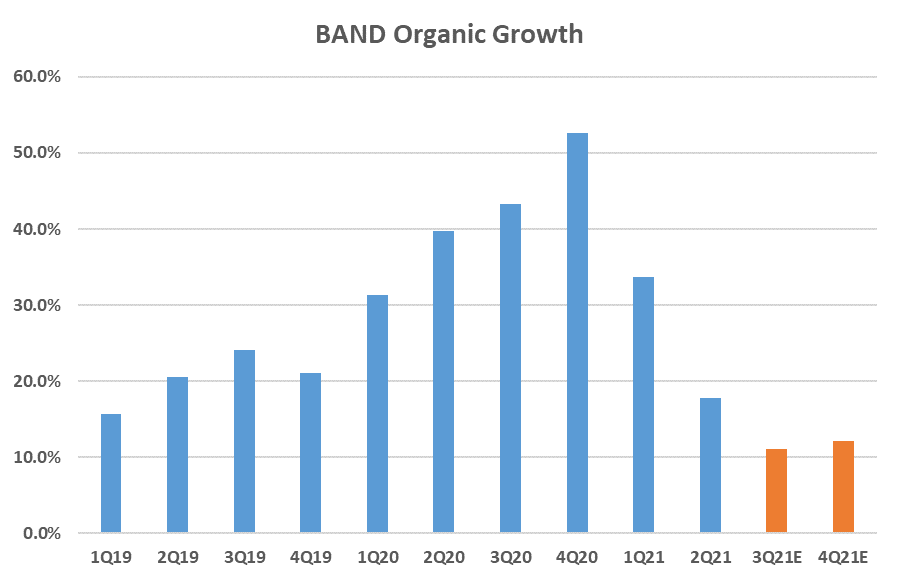
Clearly, we can see that organic growth has slowed significantly since the fourth quarter of 2020, which would normally justify a steep decline in stock price. However, it’s important to keep in mind two things that happened in 2020, which heavily skewed results. The first is COVID, which provided a considerable boost to the use of teleconferencing software. The second is the presidential election, which drove increased political text messaging. Therefore, if we adjust the company’s organic CPaaS revenue growth for management’s estimates of the impact from these two events, the chart looks more like this:
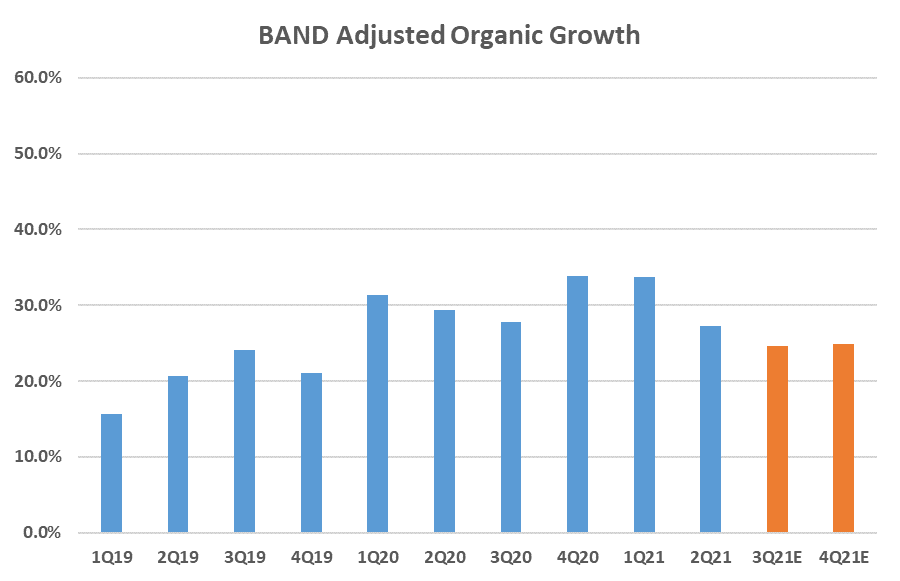
As you can see, true organic growth has changed very little, and is expected to continue at a pace of 25% – 30% over the next two quarters. Consequently, I believe the market has become massively over-pessimistic on this stock. Frankly, the situation reminds me a lot of the opportunity in Netflix back in September 2012 (see my second quarter 2018 newsletter for details) and I believe similar returns for Bandwidth are possible from here. But patience will be crucial. Because it likely won’t be until at least the second quarter of 2022 that the company reports earnings with clean year-over-year comparisons. Nevertheless, I continue to be extremely bullish on the stock and it remains our second largest position.
Portfolio Activity
I initiated a new position in the third quarter of 2021 but did not build a full position. I will introduce the company and discuss the investment thesis as soon as I do. No other adjustments to portfolio weights were made during the quarter.
Conclusion
Third quarter and year-to-date performance was, in a word, awful. Simply put, as markets continued to climb from the lows of extreme fear at the start of the COVID-19 pandemic to the highs of extreme greed today, my conservative approach to risk management has cost us. Although I’ve noted in previous newsletters the potential for underperformance given market conditions, it has been frustratingly worse than even I anticipated.
While short-term underperformance is never pleasant, my focus remains on the long-term. And, in my opinion, the future looks as bright as ever. First, we own what I believe are some of the highest quality businesses in the micro-cap space – companies with substantial competitive advantages, significant long-term growth opportunities, and exceptional management teams. And second, at a time when the overall market appears expensive, many of the stocks in our portfolio now trade at highly attractive prices. Therefore, I am optimistic that performance will turn around soon, though it is difficult to predict just when. Fortunately, clients of Kehlet Capital Management have proven to be extremely patient in weathering the ups and downs of the market, and for that I am truly grateful. As always, thank you for supporting Kehlet Capital Management, and please do not hesitate to contact me should you have any questions or comments.
| Number of holdings | 10 |
|---|---|
| Median market cap | $639M |
| Weighted avg. market cap | $1,202M |
| Fonar Corp. (FONR) | 19.7% |
|---|---|
| Bandwidth Inc. (BAND) | 13.2% |
| Callaway Golf (ELY) | 11.3% |
Disclosures to Performance Results
Actual composite performance results represent the performance of fully discretionary accounts managed by Kehlet Capital Management (KCM) during the corresponding time period. The composite performance results reflect time-weighted rates of return, the reinvestment of dividends and other account earnings. The reinvestment of dividends and other earnings may have a material impact on overall returns.
Past performance is not indicative of future results and the performance of a specific individual client account may vary substantially from the composite performance results. Therefore, no current or prospective client should assume that future performance will be profitable, or equal either the KCM composite performance results reflected above, or the performance results for any of the comparative index benchmarks provided.
For reasons including variances in portfolio account holdings, variances in the investment management fee incurred, market fluctuations, the date on which a client engages KCM’s investment management services, and any account contributions or withdrawals, the performance of a specific client’s account could vary substantially from the indicated KCM composite performance results. A portion of each account can be actively managed in an attempt to respond to changing conditions.
All performance results have been compiled solely by KCM, are unaudited, and have not been independently verified. Therefore, the performance data could be wrong. Information pertaining to KCM’s advisory operations, services, and fees is set forth in KCM’s current Form ADV Part 2A disclosure brochure, a copy of which is available from KCM upon request.
iShares IWM is an exchange-traded fund (ETF) measuring the performance of approximately 2,000 small-cap companies. It serves as a benchmark for small-cap stocks in the United States.
KCM managed accounts may own assets and follow investment strategies which cause them to differ materially from the composition and performance of the ETF shown as a benchmark. The ETF was chosen for its accessibility, transparency, independence, and relevance to KCM’s investment strategy, but there may be other indices that are more appropriate or applicable to the Concentrated Micro-cap Strategy. The historical index performance results are provided exclusively for comparison purposes only, so as to provide general comparative information to assist an individual client or prospective client in determining whether a specific Portfolio meets, or continues to meet, his/her investment objective(s). It should not be assumed that account holdings will correspond directly to any of the comparative indexes.
Different types of investments and/or investment strategies involve varying levels of risk, and there can be no assurance that any specific investment or investment strategy (including the investments purchased and/or investment strategies devised by KCM) will be either suitable or profitable for a client’s or prospective client’s portfolio and may result in a loss of principal. Accordingly, no client or prospective client should assume that the above portfolios (or any component thereof) serve as the receipt of, or a substitute for, personalized advice from KCM, or from any other investment professional.