
“I am trying to lower demand growth – we don’t know that demand actually has to go down, which would be a recession.”
“It is… uncomfortably possible that the Fed is going to slam on the brakes and push us into recession.”
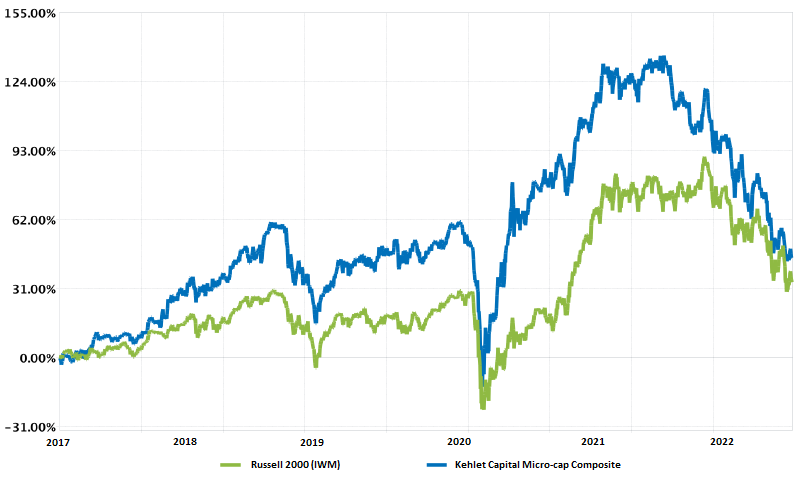
| Year | KCM Composite, Net | IWM | Excess Return |
|---|---|---|---|
| 2017* | 27.20% | 14.26% | +12.94% |
| 2018 | -3.43% | -11.11% | +7.68% |
| 2019 | 27.79% | 25.39% | +2.40% |
| 2020 | 27.52% | 20.03% | +7.49% |
| 2021 | -1.45% | 14.54% | -15.99% |
| YTD 2022 | -27.13% | -23.51% | -3.62% |
| Annualized | 6.93% | 5.55% | +1.38% |
*Inception date: 02/01/2017
Introduction
Unless you have been living under a rock for the last six months, you’re probably aware that inflation is at a 40-year high. What you may not know is that the Federal Reserve – which has the dual mandate of pursuing maximum employment and price stability – has begun tightening monetary policy to reduce economic demand and combat inflation. As such, the Fed has rapidly increased short-term interest rates – from nearly 0% in March to over 1.5% currently – and plans to hike them further by year-end – to 3.25%. But the aggressiveness of the Central Bank’s actions, combined with high levels of debt throughout the economy have many people concerned about the possibility of a recession. So, are we going into a recession and if so, how bad is it likely to be?
To answer that question, we first need to understand what is causing inflation. As I’ve discussed in previous newsletters, inflation is a complex subject. But the simplest way to think about it is through the lens of supply and demand. In other words, inflation occurs when the aggregate demand for goods and services exceeds the available supply.1 Consequently, it can be caused in two ways: by 1) a sharp increase in demand, or 2) a sharp decrease in supply. So, which one is causing inflation today? Unfortunately, it’s a bit of both. This is because when COVID-19 hit the U.S. in March 2020, both supply and demand dropped precipitously as the global economy shutdown. But, as the world re-opened, U.S. GDP (a proxy for economic demand) came roaring back, thanks to trillions of dollars in government stimulus. However, supply was much slower to recover due to 1) ongoing COVID-19 lockdowns in China and other parts of Asia, 2) economic sanctions on Russia as a result of the war in Ukraine, 3) the great resignation (i.e., a voluntary decline in the labor force participation rate), and 4) a reduction in domestic oil refining capacity due to capital and regulatory constraints. The result has been a supply and demand imbalance that looks something like this:
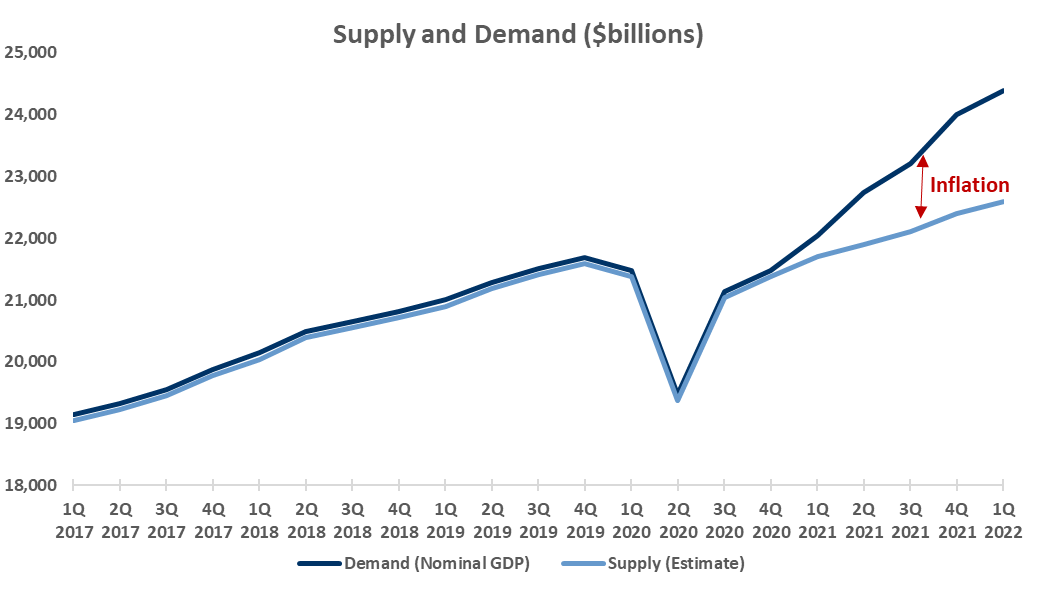
As you can see, supply (in light blue) rebounded from the COVID-19 lows at a slower rate than demand (in dark blue), which has driven inflation.
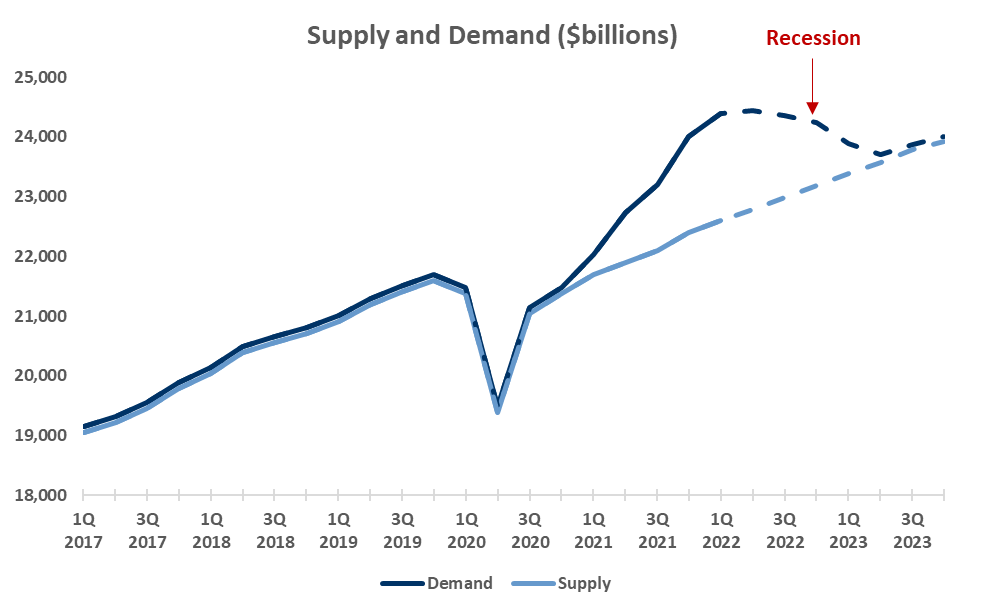
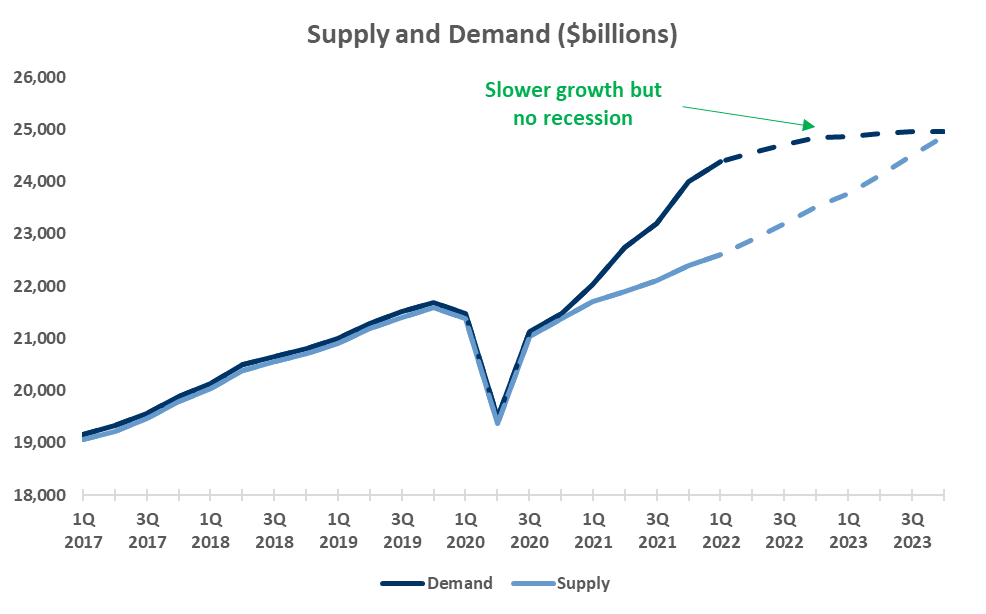
So how likely is the Fed to bring supply and demand back in line without causing a recession? In my opinion, not very. Why? Because even though supply constraints are playing a major role in causing inflation, the Fed has no control over supply. That is, it can’t remove COVID-19 lockdowns in China, lift sanctions on Russia, or increase investment in oil and gas. It can only influence the demand side of the equation through higher interest rates and a reduced balance sheet. Therefore, the only way the Fed can bring supply and demand back in line is by either reducing demand through a recession, like this:
Or slowing demand growth until supply can catch up, like this:
Obviously, the Fed would much prefer the second option. But history suggests achieving that level of precise control over the economy is virtually impossible. Consider for instance that nearly every attempt at restricting monetary policy over the last 30 years has resulted in a recession, as shown in the chart below:
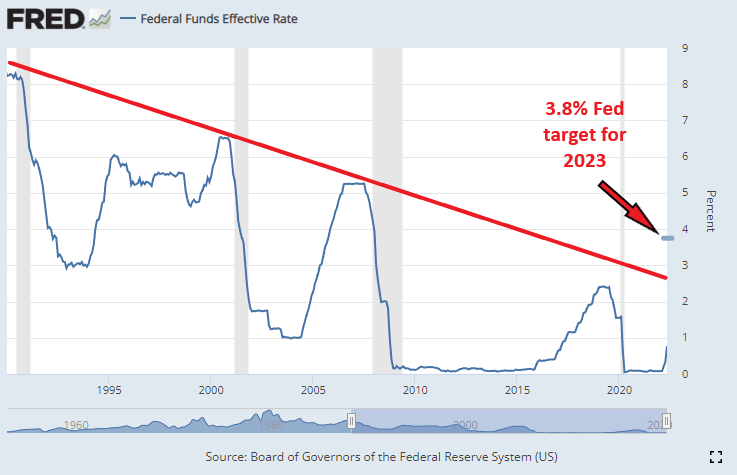
As you can see, nearly every time the federal funds rate (the blue line) has moved up, a recession (the gray shaded areas) has followed. And increasing levels of debt in the economy have resulted in lower peak interest rates with each cycle (as shown by the red line). So, if the Fed achieves its target of 3.8% by the end of 2023, interest rates would be significantly above the trendline of previous recessions. Simply put, current rate hikes are more aggressive than in the past. So, the odds of achieving a “soft” landing for the economy appear slim.
Therefore, if the Fed continues along its current path, it seems likely that we will enter a recession in the next year or two (if we aren’t in one already). But I believe any recession that does occur will be mild compared to the 2008 – 2009 financial crisis or the 2020 COVID pandemic, when global economies screeched to a halt. Because even though inflation is putting a strain on consumers, households are generally in better financial shape, banks remain well capitalized, and lending standards have been firm. Not to mention the Fed is unlikely to keep monetary policy tight for long given the government’s need to service its debt. For instance, Federal Debt as a percentage of GDP is almost 130% today vs. 60% prior to the financial crisis. This makes higher interest rates more cumbersome for the federal government, which owes more than $30 trillion in debt. For example, with interest rates just over 1%, net interest payments on government debt were $352 billion in 20212. This equates to just over 14% of federal tax receipts (the money used to fund the federal budget).3 But if interest rates were to rise to 4%, interest payments would consume nearly half of all federal tax receipts.4 Therefore, even if the Fed drives the economy into a recession, it may not be long before it pivots to a much looser monetary policy.
That said, I am by no means a macro expert. And accurately predicting economic events is extraordinarily difficult (if not impossible) to do consistently well, even for the experts. So, I could be wrong. But while it’s fun to keep track of the macro environment and provide my two cents, the truth is it has very little impact on how I pick individual stocks. Because great businesses tend to do well over the long-run regardless of what short-term economic disruptions occur along the way. Therefore, I will continue to attempt to construct a portfolio that will do well in any environment, recession or not.
Performance
During the second quarter of 2022, Kehlet Capital Management’s concentrated micro-cap composite decreased 18.76%, underperforming the benchmark which fell 17.27%.
Our largest contribution to performance came from LeMaitre Vascular (LMAT), which declined 1.71%. As a reminder, LeMaitre is a provider of medical devices for the treatment of peripheral vascular disease and has a portfolio of patent-protected, niche products designed for use in open vascular surgery.
During the second quarter LeMaitre reported its first quarter financial results, which included strong organic revenue growth of 13%. However, operating income was flat compared to the prior year due to increased expenses from a 30% ramp in headcount (mostly sales reps) to help drive further topline growth. Despite the solid results, the company is experiencing near-term headwinds from foreign exchange rates due to the stronger U.S. dollar. As a result, management lowered its full year 2022 guidance and now expects revenue growth to come in just under 5% and adjusted operating income to decline by nearly 2%. While these results aren’t anything to brag about, they do need to be taken into context. That is, they are stacked on top of two years of abnormally exceptional growth. For instance, in 2021, revenue and operating income grew 32% and 72%, respectively, compared to 2019 pre-COVID levels. Therefore, I believe this year’s results represent a return to more normal business activity, and the fundamentals of the business remain strong. However, the fact that LeMaitre was our best performer for the quarter shows just how backwards the market appears to be right now. Because, although the fundamentals of the business were strong, they were far from the best in our portfolio. Yet many of our other businesses continue to lag behind (see below).
Our largest detractor to performance was Fonar Corp. (FONR), which declined 18.11%. As our strongest performer last quarter, I noted the large disconnect between value and price in Fonar stock. And that gap widened further in the second quarter as the company reported continued strong results, including over 6% revenue growth and nearly 37% operating income growth. But despite these strong results, the company now trades at an utterly ridiculous valuation of 5.2x trailing twelve months earnings (ex-cash) and 80% of tangible book value. So, what gives? Why is this company still so cheap? While it’s difficult to know for certain, I suspect there are three main reasons:
It remains under the radar for most investors. In other words, most analysts are likely to dismiss the company at first glance given its small size (<$100 million market cap), lack of earnings calls, and poorly written annual report.5 But if they were to perform the proper due diligence, they might discover the business’ merits, which are not obvious to the casual observer.
The stock is extremely illiquid. That is, on average, less than $200,000 of Fonar stock changes hands every day. This means that even if an investor recognizes the hidden value in the company, it may not be able to move in and out of its position without unfavorably moving the price, which could cause them to stay away from the stock entirely.
Earnings growth is still obscured by some minor accounting issues – notably one-time charges from COVID and the removal of a valuation allowance for deferred tax assets – which make headline growth look worse than it actually is. While adjusting for these accounting charges is typically not a problem for most analysts, it offers one more reason an investor, giving the company only a superficial look, may not fully comprehend the true fundamentals of the business.
But this is the paradox of finding hidden investment gems – they’re valuable precisely because they’ve gone undiscovered by the market, but their value isn’t unlocked until they’re found. And this can sometimes take a long time. That said, I do not believe the disconnect between value and price will last forever and there are a number of events that could eventually unlock Fonar’s true value (e.g., a stock buyback program, a special dividend, an acquisition, etc.). Therefore, the thesis remains intact.
Portfolio Activity
No adjustments to portfolio weights were made during the quarter.
Conclusion
The second quarter was again disappointing from both a relative and an absolute basis. But as I look across the portfolio, I am struck by the significant dichotomy between the quality of businesses we own and their stock prices. In the short-term this is highly frustrating, but in the long-term I am confident the value will eventually be unlocked. In fact, Elliot Noss, the CEO of one of our portfolio companies, Tucows (TCX), illustrated this point perfectly last quarter when he said:
“I have been thinking a lot about the difference between when value is created and when value is realized. Right now, for (Tucows), there is a huge gap between the value being created and the value realized as reflected in the TCX stock price [emphasis added] … Telecom software is a new segment. Existing TCX investors have yet to fully learn it, and existing telecom investors have no idea who TCX is. And even at a purely financial level, it is difficult for investors to really understand or appreciate (our telecom software business) until the DISH migrations are substantially completed and investors can get a better sense of what ongoing subscription revenue will look like. For (our fiber internet business), while the coax-to-fiber transition in the US is a unique, multi-generational opportunity—both in terms of the returns and in terms of how much capital can be deployed—it is a long-term investment. We are virtually alone as a public company competing with private-equity backed platforms for a reason. The fantastic returns are not realized for some time and are hidden by the financials until they become ripe. A ton of value is being created, but it is a challenge to see it realized. We have been here before. In the late aughts and early teens, we had two businesses: Domains and Ting Mobile. Domains was generating solid cash and was winning in the market. Many of its competitors were starting to get squeezed by years of short-term choices while Tucows was making long term choices. The competitors were ripening on the vine into acquisition targets. Ting Mobile, meanwhile, had clearly found a better mousetrap. We had a better offering that was not yet copied by the big incumbents, we had found some customer acquisition advantages by being very early in vehicles such as podcasts, and we held on to our gains with best-in-the-world customer satisfaction. But the stock did not move until investors clearly saw the cash being generated by Ting Mobile and until the acquisition opportunities came off the vine and into our cupboard. And of course, then it moved significantly. Now, history never repeats, but it does rhyme. We have been here before. We know what the gap between value creation and value realization looks like–and we know how to both live through it and to take advantage of it. Both we and our investors have the benefit of having been here before. The benefit of experience.”
Though the market is failing to recognize the significant value creation occurring in many of our portfolio companies, we remain unfazed. Because, in my opinion, it is only a matter of time before prices correct. How long that takes is anyone’s guess but patience, as always, remains the key. Thank you for supporting Kehlet Capital Management, and please do not hesitate to contact me should you have any questions or comments.
| Number of holdings | 10 |
|---|---|
| Median market cap | $451M |
| Weighted avg. market cap | $726M |
| Fonar Corp. (FONR) | 27.2% |
|---|---|
| Wayside Technologies (WSTG) | 17.2% |
| Callaway Golf Co. (ELY) | 11.8% |
Notes
- Technically, inflation is caused by an imbalance in the supply and demand of dollars. It just manifests as a change in price-level through the supply and demand of goods and services. But there is significant overlap between the two concepts. So, to keep things simple, for our discussion we’ll assume inflation and change in price-level are the same. ↩
- “Federal Outlays: Interest”, St. Louis FRED, https://fred.stlouisfed.org/series/FYOINT ↩
- “Federal Government Current Tax Receipts”, St. Louis FRED, https://fred.stlouisfed.org/series/W006RC1A027NBEA ↩
- “Federal Debt: Total Public Debt”, St. Louis FRED, https://fred.stlouisfed.org/series/GFDEBTN ↩
- The company’s annual report bizarrely focuses on Fonar’s unattractive MRI manufacturing and servicing business, which accounts for only 10% of revenue and less than 0% of operating income. Therefore, any investor giving the company a cursory glance could easily miss Fonar’s highly attractive diagnostic imaging services business, which drives the vast majority of the economics for the company. ↩
Disclosures to Performance Results
Actual composite performance results represent the performance of fully discretionary accounts managed by Kehlet Capital Management (KCM) during the corresponding time period. The composite performance results reflect time-weighted rates of return, the reinvestment of dividends and other account earnings. The reinvestment of dividends and other earnings may have a material impact on overall returns.
Past performance is not indicative of future results and the performance of a specific individual client account may vary substantially from the composite performance results. Therefore, no current or prospective client should assume that future performance will be profitable, or equal either the KCM composite performance results reflected above, or the performance results for any of the comparative index benchmarks provided.
For reasons including variances in portfolio account holdings, variances in the investment management fee incurred, market fluctuations, the date on which a client engages KCM’s investment management services, and any account contributions or withdrawals, the performance of a specific client’s account could vary substantially from the indicated KCM composite performance results. A portion of each account can be actively managed in an attempt to respond to changing conditions.
All performance results have been compiled solely by KCM, are unaudited, and have not been independently verified. Therefore, the performance data could be wrong. Information pertaining to KCM’s advisory operations, services, and fees is set forth in KCM’s current Form ADV Part 2A disclosure brochure, a copy of which is available from KCM upon request.
iShares IWM is an exchange-traded fund (ETF) measuring the performance of approximately 2,000 small-cap companies. It serves as a benchmark for small-cap stocks in the United States.
KCM managed accounts may own assets and follow investment strategies which cause them to differ materially from the composition and performance of the ETF shown as a benchmark. The ETF was chosen for its accessibility, transparency, independence, and relevance to KCM’s investment strategy, but there may be other indices that are more appropriate or applicable to the Concentrated Micro-cap Strategy. The historical index performance results are provided exclusively for comparison purposes only, so as to provide general comparative information to assist an individual client or prospective client in determining whether a specific Portfolio meets, or continues to meet, his/her investment objective(s). It should not be assumed that account holdings will correspond directly to any of the comparative indexes.
Different types of investments and/or investment strategies involve varying levels of risk, and there can be no assurance that any specific investment or investment strategy (including the investments purchased and/or investment strategies devised by KCM) will be either suitable or profitable for a client’s or prospective client’s portfolio and may result in a loss of principal. Accordingly, no client or prospective client should assume that the above portfolios (or any component thereof) serve as the receipt of, or a substitute for, personalized advice from KCM, or from any other investment professional.