
“It is well enough that people of the nation do not understand our banking and monetary system, for if they did, I believe there would be a revolution before tomorrow morning.”
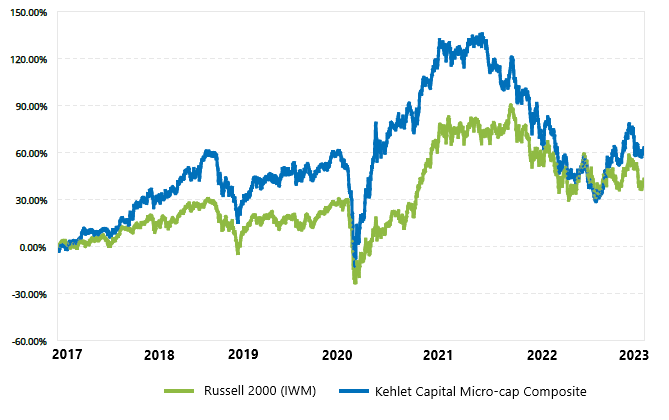
| Year | KCM Composite, Net | IWM | Excess Return |
|---|---|---|---|
| 2017* | 27.20% | 14.26% | +12.94% |
| 2018 | -3.43% | -11.11% | +7.68% |
| 2019 | 27.79% | 25.39% | +2.40% |
| 2020 | 27.52% | 20.03% | +7.49% |
| 2021 | -1.45% | 14.54% | -15.99% |
| 2022 | -22.63% | -20.48% | -2.15% |
| YTD 2023 | 6.16% | 2.70% | +3.46% |
| Annualized | 8.15% | 5.98% | +2.17% |
*Inception date: 02/01/2017
Introduction
You may have noticed that banks have been in the news lately. Three banks failed, a fourth was acquired for pennies on the dollar, and a fifth needed a $30 billion lifeline to stay afloat – all within the span of two weeks. But what exactly happened with these banks? How did we get to this point? And are more banks likely to fail?
To understand the current situation, we need to go all the way back to 2020, when COVID-related stimulus led to a huge surge in bank deposits. For example, Silvergate Bank saw its deposit base increase from $2 billion in 2020 to over $10 billion in 2021 while Silicon Valley Bank saw its deposits grow from $102 billion to $189 billion.1,2 But when deposits grow, banks need to invest that cash in order to earn a return. Typically, this is done by loaning money to individuals and businesses at higher rates of interest than what is paid to depositors on their savings. But if deposits come in faster than loans can be made, banks must find alternative ways to invest the funds. And that is exactly what they did in 2021. As deposits were surging and demand for new loans was falling, many banks used their excess cash to purchase long-term Treasury Bonds issued by the U.S. government. Due to their perceived safety, the bonds were thought to be unlikely to lose value. The problem was that most of them were purchased at a time when interest rates were historically low – approximately 2% – and prices were historically high. But the value of a Treasury Bond is inversely related to interest rates. So, when the Fed began raising rates in March 2022 at the fastest pace since the 1980’s, all the shiny new bond’s that had been purchased with customer deposits began to lose value. In fact, the unrealized losses on banks’ balance sheets were estimated to be about $620 billion by the end of 2022, or roughly 1/3 the entire capital cushion of U.S. banks (i.e., the value of the assets banks owned above and beyond what they owed depositors).3
Now, unrealized losses are generally not a problem for banks as long their deposit base remains stable. It’s only when depositors withdraw their money en masse – and banks are forced to sell their bonds to meet requests – that losses are realized. But if realized losses grow too large, uninsured depositors (those with more than $250,000 in the bank) can become fearful that their money will be lost if their bank fails. As a result, they withdraw their money, which requires the bank to sell more assets at a loss, leading to further withdrawals, and so on. This is called a “run on the bank” and it is exactly what happened last month. Here’s how the events unfolded.
First, Silvergate Bank, a bank based in California that catered to the cryptocurrency community, saw its deposits decline in the wake of FTX’s bankruptcy. As a result, it was forced to sell assets and realize a loss of $718 million in the fourth quarter of 2022. Deposits continued to fall and by Wednesday March 8th the bank announced it would undergo voluntary liquidation. That same day, another California-based bank, Silicon Valley Bank (SVB), announced that it had been forced to sell its bond portfolio for a loss of $1.8 billion. The bank, which catered to venture-capital-backed tech startups, had seen its deposits decline as many of its money-losing customers found it difficult to raise capital in a higher interest rate environment. Subsequently, SVB announced it would need to raise $2.3 billion in equity capital to shore up its balance sheet. The following day, several venture capital funds advised their portfolio companies to pull their money out of SVB. The bank, with 94% of its deposits uninsured, faced a wave of withdrawals as depositors attempted to remove $42 billion in one day.4 Since a bank cannot survive if enough depositors want to be repaid at the same time, the FDIC announced on Friday, March 10th that SVB had been closed due to inadequate liquidity and insolvency. It became the second largest bank to fail in U.S. history behind only Washington Mutual in 2008.
Then, fearing similar circumstances elsewhere, uninsured depositors started to withdraw their money at other banks as well. One of these banks was New York-based Signature Bank, which had nearly 90% of its deposits uninsured. As such, it received an avalanche of withdrawal requests placed over the weekend. In fact, it lost deposits so fast that it was forced to ask the Federal Home Loan Bank of New York for money twice within 90 minutes.5 Just one day later, on Sunday March 12th, the bank was closed by the New York State Department of Financial Services. With $110 billion in deposits at the time of closure, it became the third-largest bank to fail in U.S. history.
Since a run on the bank occurs when depositors lose confidence in a bank’s ability to keep their money safe, it is often referred to as a “crisis of confidence.” So, to restore confidence in the banking system, federal regulators announced on Sunday March 12th that the FDIC would cover all uninsured depositors at SVB and Signature Bank. They also made emergency funding available through the creation of the Bank Term Funding Program (BTFP). The program allowed eligible banks to deposit high quality assets, like Treasury Bonds, at the Fed in exchange for cash worth the face value of the asset, rather than the market value. In other words, banks were no longer required to realize losses on their bond portfolios when forced to sell.
The intervention did little to ease concerns. The next day, on Monday March 13th, regional bank stocks continued to plummet. Then, on Wednesday March 15th, the contagion spread to Europe as Switzerland-based Credit Suisse said it would need to borrow $54 billion from the Swiss Central Bank to shore up its liquidity.
On Thursday March 16th, Treasury Secretary Janet Yellen told Senators that refunds of uninsured deposits would not extend to every bank that failed, only those that posed systemic risk to the financial system.6 This caused concern that the Fed was favoring large banks by implicitly guaranteeing their deposits but not those of smaller regional banks. But the government was attempting to walk a fine line. On one hand, they needed depositors to have confidence that their funds were safe in order to contain the crisis. On the other hand, they didn’t want to explicitly guarantee all deposits for fear of moral hazard. That is, if depositors knew all their money was insured, they would have no reason to withdraw their cash from a struggling bank. But knowing that depositors were locked in, a bank might choose to hold fewer safe, low-returning assets and instead pile into riskier lines of business. As the Economist magazine recently wrote, “foreknowledge of central bank intervention may induce bad behavior.”7 As a result, regional banks continued to see withdrawals, while large banks saw their deposits surge.
That same day, First Republic Bank, which had 68% of its deposits uninsured, received a $30 billion lifeline from eleven big banks including JPMorgan Chase, Bank of America, Wells Fargo, and Citigroup. Three days later, on Sunday March 19th, Switzerland’s largest bank, UBS, agreed to take over rival Credit Suisse for more than $3 billion, or nearly 90% less than what it had been valued at just one year prior.
On March 23rd, things began to settle down as the Fed published an updated balance sheet, which showed an increase of more than $390 billion in assets over the previous two weeks. Simply put, it meant that the Fed had printed $390 billion to re-capitalize the troubled banks. Though the stimulus was expected to help contain the crisis, many wondered if it marked the end of the Fed’s quantitative tightening program (whereby it passively shrank its balance sheet in order to remove liquidity from the market and increase long-term interest rates). And if so, would it lead to prolonged inflation?
Then, on March 27th, the FDIC announced that Raleigh-based First Citizens BancShares would acquire the bulk of Silicon Valley Bank’s assets. Regional bank stocks rallied on the news. Finally, on March 30th, the Fed published an updated balance sheet, which showed a decline in assets of nearly $28 billion. It was a positive sign that banks were becoming less reliant on emergency funding and suggested that the worst of the banking crisis was behind us.
And that is largely where we stand today. So, what does it all mean and what are the implications going forward? First, it means that the banking system is probably more fragile than most people realize. This is because of the way the system, known as fractional reserve banking, works. It is based on the idea that banks take money in – in the form of low-cost deposits – and then lend that money out or invest it at higher rates of return, keeping only a fraction of the deposits in cash or cash equivalents as a reserve (hence the name fractional reserve banking). But if borrowers do not pay back the loans or investments decline in value, the bank may not have enough money to pay back depositors when they request a withdrawal. As such, the entire financial system is built on a foundation of trust; trust that banks will not lose your money. But trust is a fragile thing, and the loans and investments that banks make are inherently risky. As we have seen, even U.S. Treasuries – which are considered “risk-free” – can decline in value. Therefore, fractional reserve banking is a house of cards, with runs on the bank a recurring theme throughout history. Although the Central Bank was created to help prevent bank runs, every intervention they take seems to create new problems. It reminds me of the cartoon where the character keeps trying to plug a leak but it just causes a new one to pop up somewhere else. Therefore, I expect bank runs and financial contagion to remain a part of life until we find a better way to operate.
Second, it’s important to note that this banking crisis is very different than the one in 2008. The financial crisis of 2008 was the result of reckless lending, copious amounts of leverage, and dubious financial engineering that left banks holding extremely toxic assets. At the time, no one knew how bad the damage was, so assets were virtually impossible to value, and markets completely froze up. In short, banks that needed to generate cash couldn’t give their assets away, let alone sell them. In contrast, the unrealized losses of today are primarily in high-quality assets, like Treasury Bonds – the value of which is easily determinable, and where losses are now backed by the federal government. As a result, I do not expect a repeat of the global financial crisis anytime soon. That said, rising interest rates affect more than just Treasury Bonds, so there are likely more unrealized losses that have yet to be discovered. In fact, many analysts are now worried about the commercial real estate market, where vacancy rates are at record highs and a significant portion of loans are coming to maturity in the next year. Consequently, if losses begin to pile up in this market, we could be in for more financial and economic turbulence as well as government intervention.
Third, the recent crisis likely means that the Fed is done raising interest rates. Why? Because additional tightening would likely lead to further unrealized losses and more financial instability. Although there is still work to be done to get inflation back down to the Fed’s 2% target, financial stability would seem a much higher priority.
What does this all mean for us? Though a banking crisis does not change the way I analyze companies or how I invest, it could negatively impact the economy and the companies in our portfolio. However, it’s times like these that our portfolio should do better than most. This is because 1) we do not invest in bank stocks, which are likely to feel the most pain, 2) we hold a modest amount of cash in the portfolio, which outperforms in a down market, and 3) we own high-quality businesses – several of which that have fortress balance sheets – that should outperform low-quality businesses in a weaker economy. And if the economy instead proves resilient, we own several businesses that I believe are severely undervalued, which should help drive outperformance in a stronger economy. Simply put, I believe our portfolio is well positioned for whatever the future holds, and that returns are likely to be highly satisfactory from here.
Performance
During the first quarter of 2023, Kehlet Capital Management’s concentrated micro-cap composite increased 6.16%, outperforming the benchmark which grew 2.70%.
Our largest contribution to performance for the quarter came from Climb Global Solutions, Inc. (CLMB), which increased 69.61%. As a reminder, Climb (formerly known as Wayside Technology Group, ticker: WSTG), is a distributor of information technology (IT) software and solutions specializing in new and emerging technologies. In the third quarter 2022 newsletter I described how the stock had the potential for both multiple expansion and earnings growth. At the time, it traded at $26.88 per share with a price-to-earnings (P/E) multiple of about 10.5x. I argued, however, that the stock should trade closer to 16.0x earnings, assuming earnings growth of only 5% going forward – despite having grown at roughly 19% CAGR since current management took over 4.5 years ago. Since then, the company has reported two straight quarters of accelerated growth, with adjusted operating income (excluding one-time acquisition related costs) growing 27.2% year-over-year in the third quarter of 2022 and 43.1% in the fourth quarter of 2022. As a result, the P/E multiple expanded from 10.5x to 19.0x and the stock price increased 98.3% to $53.29. This was obviously a fantastic result and helped drive the outperformance of the portfolio over the last two quarters. The bad news is that the upside potential of the stock is much less than it was just six months ago. But the good news is that my initial valuation was highly conservative. For example, if we now assume a more reasonable (but seemingly still conservative) 10% long-term earnings growth rate going forward, the stock can still provide adequate returns without any multiple expansion whatsoever. However, at a 10% growth rate, I would argue that the stock should trade closer to 22.5x earnings, implying an additional 18% upside from multiple expansion as well. And if the company continues to grow in the 15% - 20%+ range for the foreseeable future, returns could be significantly higher than that. Though economic uncertainty may cause short-term hiccups in growth from time to time, I believe the long-term potential of the company remains intact. Therefore, despite the recent outperformance, I believe the stock is still attractively priced.
Our largest detractor to performance for the quarter was Bandwidth, Inc. (BAND), which declined 33.77%. In the third quarter 2022 newsletter I described how this stock also had the potential for multiple expansion and earnings growth. At the time, it traded at $11.90 per share with an estimated steady state multiple of around 16.5x. I argued however, that the stock should trade closer to 30.0x earnings, assuming growth of only 10% going forward – despite having grown by nearly 30% CAGR since 2019.8 And in the third quarter of 2022, the company grew revenue by 13.5% year-over-year while management provided forward guidance of 16.5% growth for the fourth quarter. As a result, the stock price increased 92.79%, to $22.95, in the fourth quarter of last year and was our largest contribution to performance at the time. But the following quarter the company grew revenue by 24.5% and the stock fell 33.77% to $15.20. Why? Because management provided forward guidance for first quarter and full year 2023 revenue growth of only 1.2%, far below my 10% long-term estimate. So, what’s going on? First, management noted that the business had become more cyclical as political text messaging now drives a meaningful portion of revenue every two years. Thus, while the company benefitted from an election cycle in 2022, it will not see that same revenue boost in 2023. But if we exclude this revenue from both years, for a more apples-to-apples comparison, normalized revenue growth is expected to be roughly 8% in 2023 – much closer to my 10% estimate. Second, management has a long history of providing overly conservative guidance. In fact, I can only remember one time since the IPO that they did not significantly beat guidance. Management also noted an increased level of conservatism this quarter due to the uncertain economic environment. As a result, I believe they will once again beat guidance in Q1 and perhaps by a wide margin. In fact, I would not be surprised to see adjusted revenue growth come in closer to the 13% - 15% range. Additionally, I believe the long-term potential of the company remains highly attractive and that 2024 will be an outstanding year for Bandwidth. Simply put, political text messaging revenue from the presidential election is likely to drive substantial growth in 2024 against an easy comparison in 2023. Therefore, I believe the thesis remains intact and there continues to be tremendous upside in this stock.
Portfolio Activity
No adjustments to portfolio weights were made during the quarter.
Conclusion
The first quarter of 2023 was off to a good start despite the turmoil from the recent banking crisis. Though the economic impact of recent events remains unknown, I believe we are well positioned for whatever the future may hold. Thank you again for supporting Kehlet Capital Management, and please do not hesitate to contact me should you have any questions or comments.
| Number of holdings | 10 |
|---|---|
| Median market cap | $409M |
| Weighted avg. market cap | $403M |
| Fonar Corp. (FONR) | 25.8% |
|---|---|
| Climb Global Solutions (CLMB) | 24.4% |
| Bandwidth, Inc. (BAND) | 10.5% |
Notes
- Liao, Rita, “Crypto-friendly bank SIlvergate to wind down after FTX blow-up”, TechCrunch, https://techcrunch.com/2023/03/08/crypto-friendly-bank-silvergate-to-wind-down-after-ftx-blow-up/ ↩
- Flitter, Emily and Copeland, Rob, “Silicon Valley Bank Fails After Run on Deposits”, The New York times, https://www.nytimes.com/2023/03/10/business/silicon-valley-bank-stock.html ↩
- “Remarks by FDIC Chairman Martin Gruenberg at the Institute of International Bankers”, FDIC, https://www.fdic.gov/news/speeches/2023/spmar0623.html?source=govdelivery&utm_medium=email&utm_source=govdelivery ↩
- Egan, Matt and Morrow, Allison and Goldman, David, “First Republic secures $30 billion rescue from large banks, “CNN Business”, https://www.cnn.com/2023/03/16/investing/first-republic-bank/index.html ↩
- “Signature Bank”, Wikipedia, https://en.wikipedia.org/wiki/Signature_Bank ↩
- Wilkie, Christina and Cox, Chelsey, “Treasury Secretary Yellen says not all uninsured deposits will be protected in future bank failures”, CNBC, https://www.cnbc.com/2023/03/16/svb-signature-bank-failures-yellen-says-us-banking-system-is-stable-and-deposits-remain-safe.html ↩
- 2023, March 18th – 24th, “Free exchange: After the rescue”, The Economist, Volume 446, page 66 ↩
- The astute reader will notice that I used 10% growth for both CLMB and BAND, but suggested CLMB’s P/E multiple should be 22.5x while BAND’s should be 30.0x. The difference is capital structure. Since BAND has significantly more debt than CLMB, 10% growth in operating earnings leads to much higher growth in net income. And higher growth = a higher multiple. ↩
Disclosures to Performance Results
Actual composite performance results represent the performance of fully discretionary accounts managed by Kehlet Capital Management (KCM) during the corresponding time period. The composite performance results reflect time-weighted rates of return, the reinvestment of dividends and other account earnings. The reinvestment of dividends and other earnings may have a material impact on overall returns.
Past performance is not indicative of future results and the performance of a specific individual client account may vary substantially from the composite performance results. Therefore, no current or prospective client should assume that future performance will be profitable, or equal either the KCM composite performance results reflected above, or the performance results for any of the comparative index benchmarks provided.
For reasons including variances in portfolio account holdings, variances in the investment management fee incurred, market fluctuations, the date on which a client engages KCM’s investment management services, and any account contributions or withdrawals, the performance of a specific client’s account could vary substantially from the indicated KCM composite performance results. A portion of each account can be actively managed in an attempt to respond to changing conditions.
All performance results have been compiled solely by KCM, are unaudited, and have not been independently verified. Therefore, the performance data could be wrong. Information pertaining to KCM’s advisory operations, services, and fees is set forth in KCM’s current Form ADV Part 2A disclosure brochure, a copy of which is available from KCM upon request.
iShares IWM is an exchange-traded fund (ETF) measuring the performance of approximately 2,000 small-cap companies. It serves as a benchmark for small-cap stocks in the United States.
KCM managed accounts may own assets and follow investment strategies which cause them to differ materially from the composition and performance of the ETF shown as a benchmark. The ETF was chosen for its accessibility, transparency, independence, and relevance to KCM’s investment strategy, but there may be other indices that are more appropriate or applicable to the Concentrated Micro-cap Strategy. The historical index performance results are provided exclusively for comparison purposes only, so as to provide general comparative information to assist an individual client or prospective client in determining whether a specific Portfolio meets, or continues to meet, his/her investment objective(s). It should not be assumed that account holdings will correspond directly to any of the comparative indexes.
Different types of investments and/or investment strategies involve varying levels of risk, and there can be no assurance that any specific investment or investment strategy (including the investments purchased and/or investment strategies devised by KCM) will be either suitable or profitable for a client’s or prospective client’s portfolio and may result in a loss of principal. Accordingly, no client or prospective client should assume that the above portfolios (or any component thereof) serve as the receipt of, or a substitute for, personalized advice from KCM, or from any other investment professional.