
“The secret to investing is to figure out the value of something – and then pay a lot less”
| Year | KCM Composite, Net | IWM | Excess Return |
|---|---|---|---|
| 2017* | 27.20% | 14.26% | +12.94% |
| 2018 | -3.43% | -11.11% | +7.68% |
| 2019 | 27.79% | 25.39% | +2.40% |
| 2020 | 27.52% | 20.03% | +7.49% |
| 2021 | -1.45% | 14.54% | -15.99% |
| 2022 | -22.63% | -20.48% | -2.15% |
| 2023 | 23.12% | 16.84% | +6.28% |
| YTD 2024 | -0.09% | 1.62% | -1.71% |
| Annualized | 8.87% | 7.02% | +1.85% |
*Inception date: 02/01/2017
Introduction
When it comes to investing, there may be no skill more important than accurately valuing a business. Because, in the end, investing is about buying assets you believe are worth more than what you pay for them. However, valuation is a complex task. Many of the concepts are challenging to grasp, and even minor mistakes can lead to significant errors. Simply put, it is a skill that takes considerable time and effort to learn. The good news is that you don’t need to be a valuation expert to invest in the stock market. But you should at least know the basics. Otherwise, it’s just gambling. As value investor Joel Greenblatt once wrote, “Choosing individual stocks without any idea of what you’re looking for is like running through a dynamite factory with a burning match. You may live, but you’re still an idiot.” In this newsletter, I plan to arm you with the basic concepts of valuation, show how they can be used to analyze individual stocks and help investors avoid getting blown up.
At the most basic level, the value of a business is equal to the present value of its future cash flows. In other words, a company is only worth the money you can get back from it, minus some discount based on your desired rate of return. For example, imagine you wanted to buy a business that was guaranteed to generate $1 million over the next year and then cease to exist. How much should you be willing to pay for it? That depends on your desired rate of return – also known as your discount rate. If you didn’t care about making a profit and your desired rate of return was 0%, you would be willing to pay the full $1 million for the business:
However, if you wanted to earn at least a 10% return on your investment, you would be willing to pay a maximum of $909,091 for that same business:
That is known as a discounted cash flow analysis (DCF), and it is probably the most common valuation tool used by financial professionals. Though simple in theory, it’s much more complex in practice. For instance, in the example above, I simplified the problem to a single cash flow of known quantity and timing. However, businesses generate numerous cash flows over many years or decades. To determine the firm’s total value, one must discount each cash flow separately and add them together. However, the timing and amount of these cash flows is highly uncertain. As a result, they can only be estimated based on various assumptions about future sales, profit margins, tax rates, and capital investment requirements. Underlying these estimates are another set of assumptions regarding market size, growth rates, attainable market shares, gross margins, overhead expense ratios, working and fixed capital requirements, leverage, and the costs of debt and equity.1 Therefore, any estimate of value using a discounted cash flow analysis is largely conjecture.
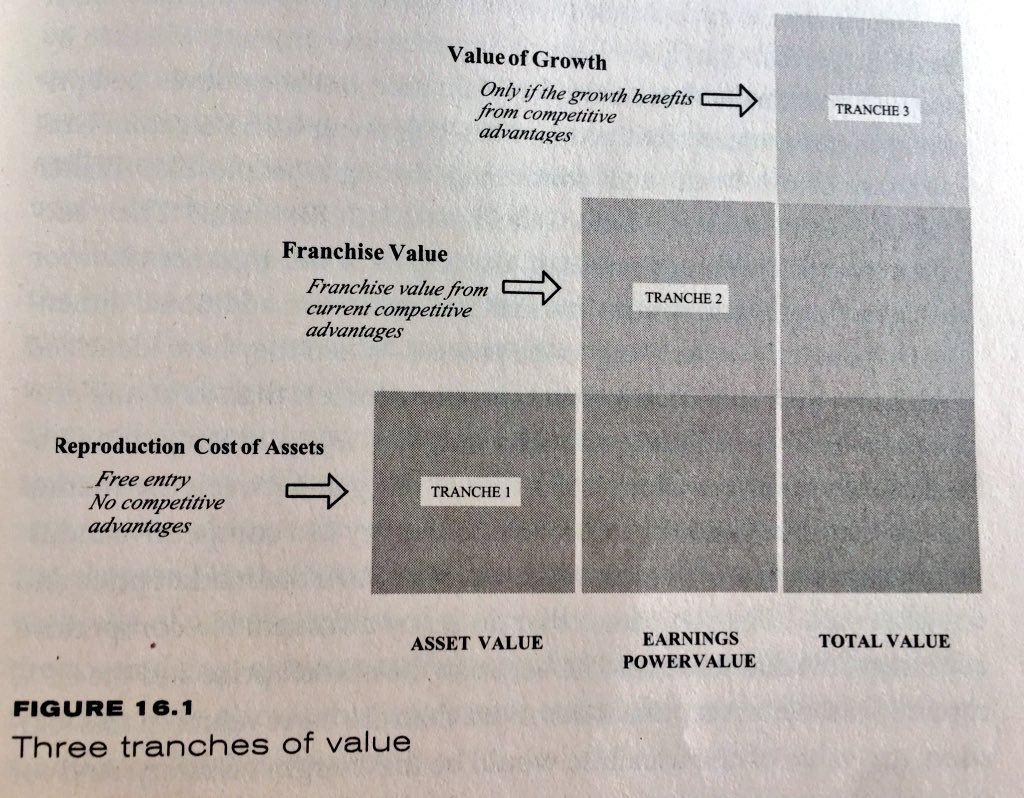
In my opinion, a simpler and more robust approach is the one described by Bruce Greenwald and Judd Kahn in their book Competition Demystified. They argue that valuation should be thought of in three layers of increasing uncertainty:
The first layer values a company based on only the most reliable information available: the information on its balance sheet. That is, determining the net asset value of a firm – its assets minus its liabilities – does not typically require any projections into the future. But it does tell us how much a business would be worth if it were unable to create value for shareholders (i.e., earn a return above its cost of capital). However, calculating net asset value depends on whether the firm is economically viable (i.e., whether it can continue to operate as a going concern). For example, if a company is not economically viable, its assets should be priced at their liquidation value – the amount the company would receive if it were to sell its assets in bankruptcy. As Greenwald and Kahn explain, “accounts receivable and inventory will have to be written down from their balance sheet levels. The discount will be small for accounts receivable since they are largely recoverable in liquidation. For inventories, the discount will be larger since some items may be obsolete and worth little. The value of properties, plants, and equipment (PPE) for a nonviable industry will depend on whether they are specific to the industry or general purpose. Industry-specific PPE will be worth only its scrap value. General-purpose PPE, such as office buildings, will usually trade in active secondhand markets, and these market values should be realized in liquidation. Intangibles, like brands, customer relationships, and product portfolios, will have limited or no value in liquidation. The liabilities must be subtracted from the value of the assets, generally at full value, since in any liquidation short of bankruptcy, they must be fully paid off." However, if a company is economically viable, the assets should be valued at their reproduction cost – or the cost of reproducing their economic function as efficiently as possible. For instance, “for cash and marketable securities there is no discrepancy between reported value and reproduction cost. For accounts receivable, the reproduction cost will actually be slightly higher than accounting book value. Receivables are essentially loans to customers generated by sales made in the normal course of business, and some of the loans will not be repaid.”2 The key takeaway is not how to calculate a business's net asset value precisely but rather that net asset value is the foundation on which all companies should be valued. As such, it can be considered the lowest attainable price, even for the worst of businesses.3
The second layer of valuation is based on the next most reliable information for determining value: the cash flow a business can distribute over the near term – or its current earnings power. This approach attempts to value a company based on the assumption that the current level of net cash flow will be sustained forever, neither growing nor shrinking. Although the method does call for some extrapolation into the future, it is less uncertain than a standard discounted cash flow analysis since it assumes no growth. To determine a business's sustainable distributable earnings – or "earnings power" – we start with reported earnings and then make several adjustments. Though none are particularly complicated, they may seem daunting to those unfamiliar with financial statements. First, to eliminate the effects of capital structure – the amount of debt the company borrows relative to its equity – we start with the operating earnings, or earnings before interest and taxes (EBIT), rather than net income. This allows us to disregard both the company's interest payments and the tax benefits it gets from using debt financing. We then adjust for nonrecurring items, cyclical variations, and special circumstances. Once we arrive at the earnings power of a business, we must convert it into an earnings power value (EPV). This requires dividing the earnings power by the cost of capital. For example, a company with an after-tax earnings power of $100 million and a cost of capital of 8% would have an earnings power value of $1.25 billion:
It should be noted that the value calculated here is that of the entire firm (debt plus equity).4 The value of the equity is this total less the value of the firm’s outstanding debt. The reason for focusing on the overall firm rather than just the equity is that the estimate for the entire firm is more reliable, especially when it has a high level of debt. In other words, the value is far less prone to error than one focused solely on equity. Once the earnings power value has been determined, we can compare it to the net asset value from the previous step. If the earnings power value is less than or equal to the net asset value, we can disregard it and use the net asset value. However, if the earnings power value exceeds the net asset value it means the company is creating value in excess of the reproduction costs of the assets. However, this level of earnings power can only be sustained if there are barriers to entry. As a result, the valuation decision – whether to use the value of the assets or the value of the earnings power – comes down to a strategic judgment of whether the enterprise enjoys competitive advantages. If it does, earnings power value is the more appropriate measure. If not, net asset value should be used.5
The third and final layer of valuation integrates the effects of growth. However, because growth results from putting resources to work, it’s important to note that growth destroys value in the hands of poor management or a competitive disadvantage. In other words, only growth in the presence of existing competitive advantages creates value. Though a discounted cash flow analysis can be helpful in “growth is good” situations, the strategic approach is essential because it highlights the one element that makes growth valuable – the presence of sustainable competitive advantages in a growing market – and separates the valuation into tranches of increasing uncertainty6:
With this approach, it becomes clear that what matters most to the value of a stock is not what happens with its price but what happens to its fundamentals – its asset value and earnings power. Therefore, by comparing the stock price to the fundamentals, we can gain valuable insight into whether a company is overvalued or undervalued. Consider Kehlet Capital Management’s two largest positions, FONAR Corp. (FONR) and Bandwidth Inc. (BAND). When we began acquiring shares of FONAR in November 2019, the company had a tangible net asset (layer 1) value of approximately $14.14 per share and a stock price of $20.12. Nearly five years later, the tangible net asset value has increased 56% to $22.06 per share, while the stock price has declined more than 20% to roughly $16 (as shown below):
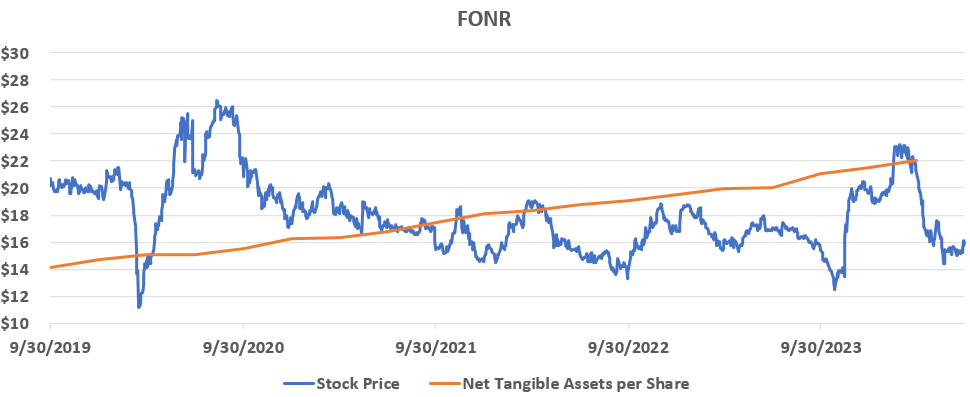
As you can see, the fundamentals tell a very different story than the stock price. In fact, FONAR is now selling for ~27% less than its layer 1, “do not sell below” valuation. From a fundamental perspective, it is one of the most significant no-brainer investments I have ever encountered. However, investors focused solely on the stock price could easily be fooled into thinking otherwise.
Now, let’s look at Bandwidth. In February 2019, the company had an estimated after-tax earnings power (layer 2) of $1.53 per share and traded at an enterprise value of $48.35 per share.7,8 Nearly five years later, the estimated earnings power has increased almost 52% to $2.32 per share, while the enterprise value has declined nearly 43% to approximately $26.50.
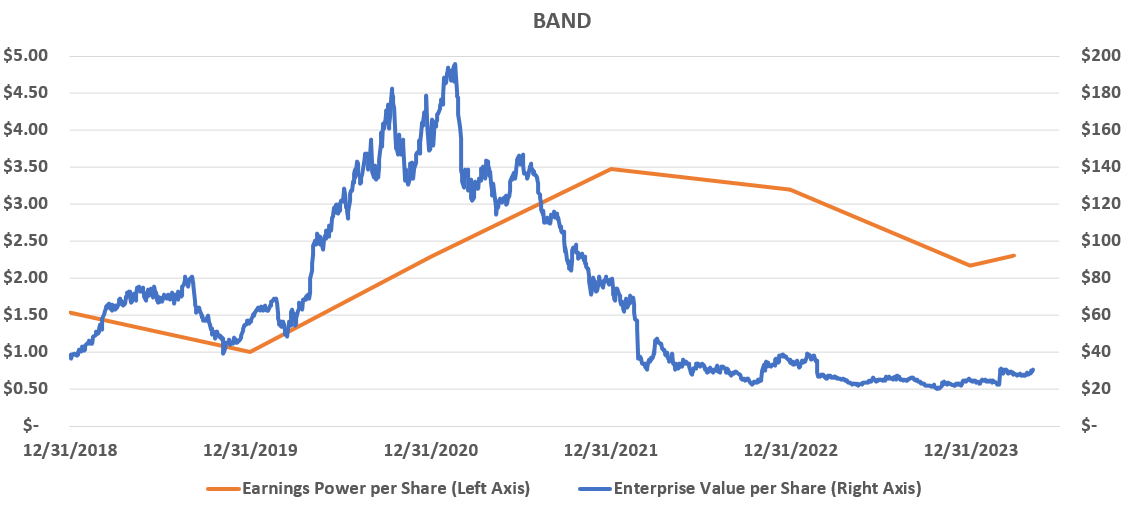
Again, the business fundamentals paint a completely different picture than the stock price.
Meanwhile, other companies are experiencing the opposite trend. For example, Gamestop Corp. (GME), a videogame retailer whose business has declined for several years, has seen its gross profit per share decrease for six consecutive years and has generated an operating loss in each of the last five. Yet its stock price has increased over 1,500% since the end of 2019, and today, trades at roughly 5.0x its trailing twelve-month gross profit. Compare this to a gross profit multiple of 2.9x for Bandwidth and 2.0x for FONAR, which have grown gross profit per share at an average annual rate of 12.2% and 2.2% over the last five years.9
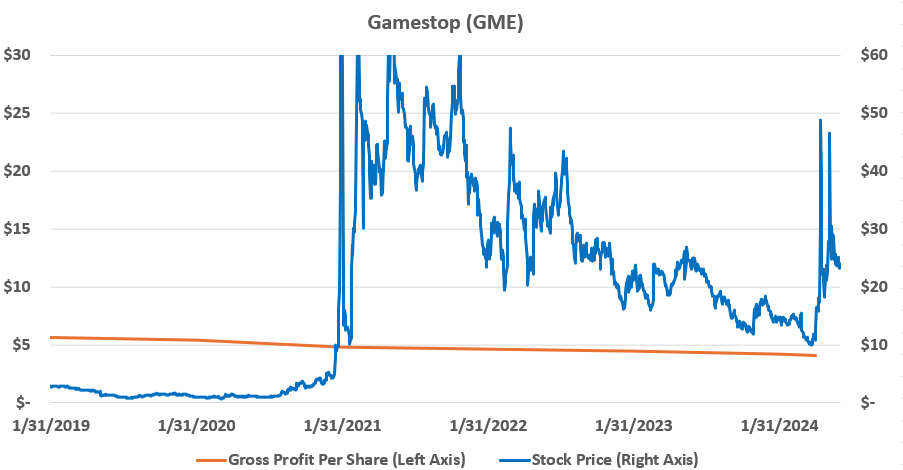
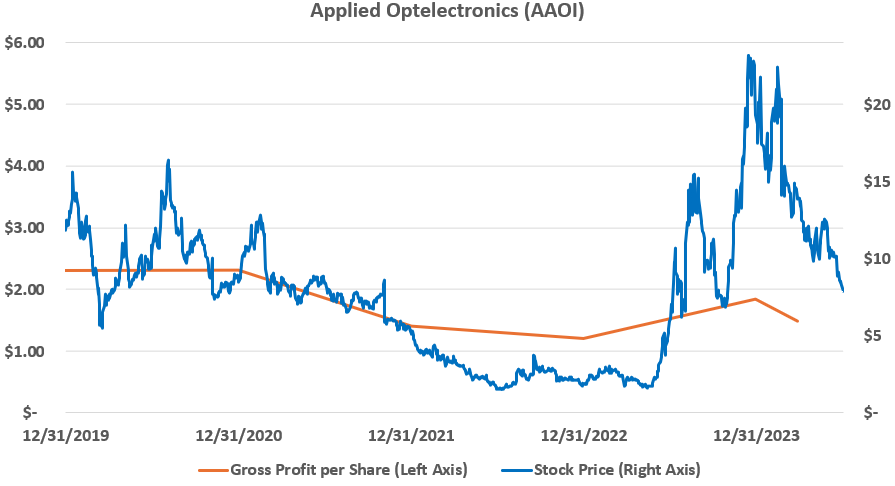
Most people are familiar with Gamestop’s story, but its apparent overvaluation is not an outlier. Take Applied Optoelectronics (AAOI), a designer and manufacturer of optical communications products. Though the company has generated an operating loss every year since 2019, and its gross profit per share has declined by more than 35% over that same time10, its stock price has outpaced its earnings power (see chart below) and now trades at 6.8x gross profit, implying significant growth and profitability in the future despite every indication to the contrary.
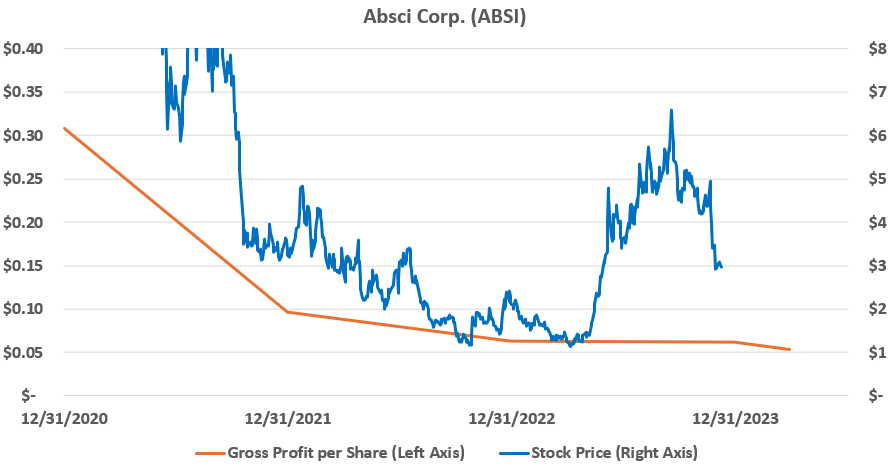
Or how about Absci Corp. (ABSI), a drug discovery platform provider to the pharmaceutical industry? It has generated an operating loss every year since 2020, and its gross profit per share has fallen by almost 84%.11 Yet its stock price has fared much better than the company’s fundamentals and now trades at roughly 32x gross profit.
But those are just a few examples of apparent overvaluation in the market right now. So, what is going on? Why are so many stocks trading favorably to their fundamentals while ours continue to struggle? While I can only speculate, I believe it is because the market is entering bubble territory. As I wrote in my first quarter 2021 newsletter, one of the most popular ways to measure overall market valuation is with the cyclically adjusted price to earnings (CAPE) ratio, which compares the price of the S&P 500 index to the earnings power of its constituents over the previous ten years, adjusted for inflation. The chart below shows the CAPE ratio over the last 140+ years:
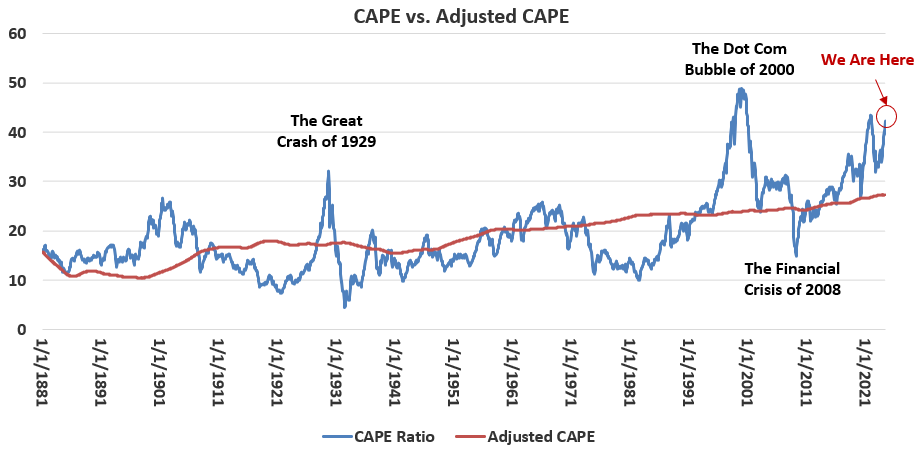
The blue line is the CAPE ratio, and the red line is an estimate of fair value based on historical averages of interest rates, equity risk premiums, and corporate earnings growth. When the blue line is below the red line, it suggests the market is undervalued; when it is above the red line, it indicates the market is overvalued. As you can see, we are within a stone’s throw of some of the most significant stock market bubbles in U.S. history. And when bubbles expand, markets act irrationally. Value investing and risk management become of little importance. When that happens, our relative performance is likely to suffer. The bad news is that market irrationality can last a long time, and we may only be in this bubble’s early to middle stages. However, the good news is that our portfolio can do well regardless of the market environment. If prices continue to increase, the value of our stocks should eventually be realized as the arbitrage opportunity between price and value becomes too good to pass up. And if the bubble pops and equity prices fall, our portfolio could see significant outperformance given the downside protection created by our cash position and already undervalued stocks. Either way, with patience, I’m confident our perseverance will eventually pay off.
Performance
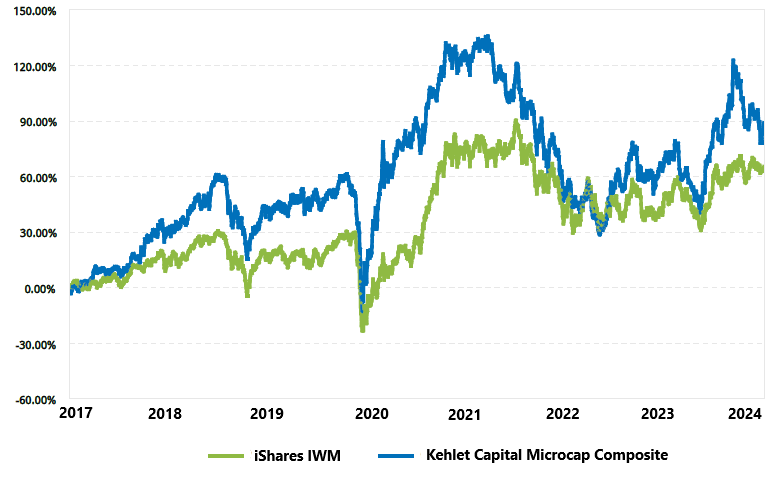
During the second quarter of 2024, Kehlet Capital Management’s concentrated micro-cap composite declined 10.72%, underperforming the benchmark, which fell 3.25%.
Our largest contribution to performance came from Astronics Corp. (ATRO), which increased 5.21%. During the second quarter, the company reported its first quarter financial results, which included revenue growth of 22.8%, gross profit growth of 57.7%, and an operating profit of $1.6M – up from a loss of $8.2M in the same quarter last year.12 In addition, bookings grew 30.0% year over year and 12.0% sequentially, resulting in a book-to-bill ratio of 1.11. Though management expects to see some short-term headwinds in the Aerospace segment from a reduction in Boeing’s 737MAX production rates, overall demand remains strong, with TSA passenger volume up 7.1% so far this year.13 The company also announced two large contract wins during the second quarter in the Test Systems segment. The first was for Astronics’ Dual-Modem Modem Manager, which helps airlines manage inflight connectivity and is valued at up to $75M over the next 3 – 5 years. The second was for the management, engineering, and manufacturing to update a range of radio communication devices for the U.S. Army. The contract is valued at up to $215M over the next five years. Therefore, Astronics has strong momentum heading into the second half of the year and should be able to carry it into 2025. The thesis remains intact.
Our largest detractor to performance was FONAR Corp. (FONR), which declined 25.08%. During the quarter, the company reported its financial results, which included revenue growth of 1.2%, an operating income decline of 10.1%, and no share repurchases. Although the results were somewhat disappointing, two items put me at ease. First, the year-to-date results remain solid, with revenue up 5.5% and operating income up 23.5% through the first nine months of the company’s fiscal year. Second, the expectations for this business remain at rock bottom, given its valuation of 73% of net tangible book value. These factors, combined with the company’s continued investments in new equipment, facilities, and productivity-enhancing AI imaging software, give me confidence that FONAR’s fundamentals will far outpace the low bar set by the market. The thesis remains intact.
Portfolio Activity
No adjustments to portfolio weights were made during the quarter.
Conclusion
The second quarter of 2024 was disappointing from an absolute and relative return perspective. However, the fundamentals of the businesses we own remain strong despite the stories being told by their stock prices. Based on these fundamentals, I am optimistic about our portfolio for the back half of the year and beyond, regardless of the market environment. When rationality inevitably returns, and the importance of valuation regains relevance, we should do exceedingly well. Thank you again for supporting Kehlet Capital Management, and please do not hesitate to contact me should you have any questions or comments.
| Number of holdings | 9 |
|---|---|
| Median market cap | $372M |
| Weighted avg. market cap | $338M |
| Fonar Corp. (FONR) | 22.1% |
|---|---|
| Bandwidth Inc. (BAND) | 18.7% |
| Climb Global Solutions (CLMB) | 15.9% |
Notes
- Greenwald, Bruce and Kahn, Judd, Competition Demystified: A Radically Simplified Approach to Business Strategy, (New York: Penguin Group, 2005), pgs. 322 – 324. ↩
- Greenwald, Bruce and Kahn, Judd, Competition Demystified: A Radically Simplified Approach to Business Strategy, (New York: Penguin Group, 2005), pg. 328. ↩
- An exception to this rule would be companies where management rapidly destroys value by investing in negative NPV projects, resulting in a quickly deteriorating net asset value. However, these situations are relatively rare and, in my opinion, obvious and avoidable. Therefore, in most cases, the point still holds. ↩
- If the firm has valuable assets that are not necessary to its basic operations and whose returns are not included in operating earnings, such as excess cash or real estate, the value of these assets should be added to the earnings power value to get the total value of the firm. ↩
- Greenwald, Bruce and Kahn, Judd, Competition Demystified: A Radically Simplified Approach to Business Strategy, (New York: Penguin Group, 2005), pgs. 330 - 336 ↩
- Greenwald, Bruce and Kahn, Judd, Competition Demystified: A Radically Simplified Approach to Business Strategy, (New York: Penguin Group, 2005), pgs. 337 - 339 ↩
- Based on KCM analysis ↩
- I use enterprise value here rather than stock price to keep the comparison apples-to-apples. Since my estimate of earnings power starts with operating income rather than net income, enterprise value is the more appropriate measuring stick. ↩
- Though comparing operating profit multiples is preferable, Gamestop’s lack of operating income makes such a comparison useless. ↩
- Based on KCM earnings power estimates of $2.31 per share in 2019 and $1.49 at the time of this writing ↩
- Based on KCM earnings power estimates of $0.31 in 2020 and $0.05 today ↩
- Revenue and gross profit exclude $5.8M in sales related to the reversal of a deferred revenue liability recognized in 2023 ↩
- https://www.tsa.gov/travel/passenger-volumes ↩
Disclosures to Performance Results
Actual composite performance results represent the performance of fully discretionary accounts managed by Kehlet Capital Management (KCM) during the corresponding time period. The composite performance results reflect time-weighted rates of return, the reinvestment of dividends and other account earnings. The reinvestment of dividends and other earnings may have a material impact on overall returns.
Past performance is not indicative of future results and the performance of a specific individual client account may vary substantially from the composite performance results. Therefore, no current or prospective client should assume that future performance will be profitable, or equal either the KCM composite performance results reflected above, or the performance results for any of the comparative index benchmarks provided.
For reasons including variances in portfolio account holdings, variances in the investment management fee incurred, market fluctuations, the date on which a client engages KCM’s investment management services, and any account contributions or withdrawals, the performance of a specific client’s account could vary substantially from the indicated KCM composite performance results. A portion of each account can be actively managed in an attempt to respond to changing conditions.
All performance results have been compiled solely by KCM, are unaudited, and have not been independently verified. Therefore, the performance data could be wrong. Information pertaining to KCM’s advisory operations, services, and fees is set forth in KCM’s current Form ADV Part 2A disclosure brochure, a copy of which is available from KCM upon request.
iShares IWM is an exchange-traded fund (ETF) measuring the performance of approximately 2,000 small-cap companies. It serves as a benchmark for small-cap stocks in the United States.
KCM managed accounts may own assets and follow investment strategies which cause them to differ materially from the composition and performance of the ETF shown as a benchmark. The ETF was chosen for its accessibility, transparency, independence, and relevance to KCM’s investment strategy, but there may be other indices that are more appropriate or applicable to the Concentrated Micro-cap Strategy. The historical index performance results are provided exclusively for comparison purposes only, so as to provide general comparative information to assist an individual client or prospective client in determining whether a specific Portfolio meets, or continues to meet, his/her investment objective(s). It should not be assumed that account holdings will correspond directly to any of the comparative indexes.
Different types of investments and/or investment strategies involve varying levels of risk, and there can be no assurance that any specific investment or investment strategy (including the investments purchased and/or investment strategies devised by KCM) will be either suitable or profitable for a client’s or prospective client’s portfolio and may result in a loss of principal. Accordingly, no client or prospective client should assume that the above portfolios (or any component thereof) serve as the receipt of, or a substitute for, personalized advice from KCM, or from any other investment professional.