
“I’d gladly pay you Tuesday for a hamburger today.”
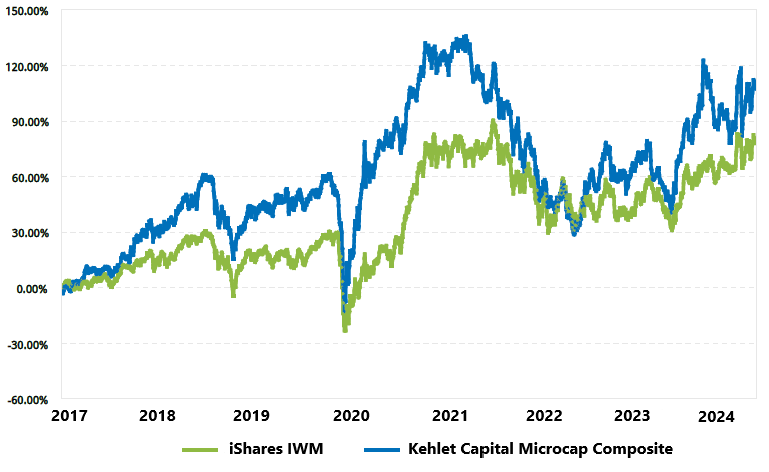
| Year | KCM Composite, Net | IWM | Excess Return |
|---|---|---|---|
| 2017* | 27.20% | 14.26% | +12.94% |
| 2018 | -3.43% | -11.11% | +7.68% |
| 2019 | 27.79% | 25.39% | +2.40% |
| 2020 | 27.52% | 20.03% | +7.49% |
| 2021 | -1.45% | 14.54% | -15.99% |
| 2022 | -22.63% | -20.48% | -2.15% |
| 2023 | 23.12% | 16.84% | +6.28% |
| YTD 2024 | 9.57% | 11.02% | -1.45% |
| Annualized | 9.88% | 8.02% | +1.86% |
*Inception date: 02/01/2017
Introduction
Last quarter, I wrote about using a business’s earnings to determine its value. I noted how the earnings should be adjusted for nonrecurring items, cyclical variations, and special circumstances. But what about stock-based compensation? Some companies use it a lot, others just a little. But nearly every company uses it to some degree. However, despite its prevalence, there is still debate among financial professionals and investors as to whether it should be treated as an expense. Warren Buffett believes it should, saying, “If (stock) options aren’t a form of compensation, what are they? (And) if compensation isn’t an expense, what is it?” Yet, many companies continue to exclude stock-based compensation from their non-GAAP results. So, who is right? In this newsletter, I will describe the characteristics of stock-based compensation, discuss whether it should be considered an expense, and suggest how investors can account for it.
First, what exactly is stock-based compensation? As the name implies, it is a payment to employees in the form of stock, stock options, or restricted stock units. Companies primarily use it for three reasons:
To preserve cash. By paying a portion of workers’ salaries in stock, a company can save money to finance other areas of the business. This is particularly helpful for capital-constrained companies, such as start-ups.
To incentivize employee retention. Employees are less likely to quit if it means forfeiting significant unvested stock.
To give employees a sense of ownership of the company and improve worker engagement and decision-making.
However, a few things happen when a business pays out stock-based compensation. First, the company creates new shares and grants them to employees in exchange for labor.1 Second, the number of shares outstanding increases, thus reducing current shareholders’ ownership in the business. Third, management estimates the true expense and deducts it from earnings. Since it’s impossible to know precisely how much the company’s shares will be worth in the future, the true value of stock-based compensation can only be estimated. Finally, employees receive cash for their newly created shares by selling them on the open market.
So, what is going on here? Imagine you and three of your friends order a pizza cut into eight slices. The four of you, collectively known as the “pizzaholders,” are each entitled to two slices. The group then decides to hire a babysitter to watch the kids. None of you have any cash on hand. But as luck would have it, the babysitter accepts pizza-based compensation. So, you cut the pizza into 16 slices and give eight to the babysitter. That is the equivalent of stock-based compensation.2 Though no cash changed hands, and each of the original “pizzaholders” still received two slices, the group compensated the babysitter by reducing the size of their slices. Therefore, shareholders bear the cost of stock-based compensation in the form of dilution.
So, is stock-based compensation an expense? Absolutely. Though many companies exclude it from their non-GAAP earnings, it is a very real cost to shareholders and should be included in estimates of fair value. There are two ways to do this: 1) by reducing future earnings by the estimated compensation expense while keeping total shares outstanding constant, or 2) by excluding the expense from future earnings but increasing shares outstanding by an appropriate amount. Though the second method is technically correct, I prefer the first since it is easier to predict. The reason is that companies typically issue stock-based compensation based on a total dollar value rather than a target amount of dilution. And since stock prices can fluctuate unpredictably, so can the amount of dilution that occurs. As a result, the dollar value tends to be more stable and predictable than the amount of dilution. It’s important to note that the estimated dollar value of stock-based compensation, though the better of the two options, is still highly uncertain. This is because a share of stock represents a claim on future earnings, which are also uncertain. Therefore, if a company’s earnings and stock price perform well over time, its stock-based compensation may be significantly higher than originally estimated. And if the company performs poorly, the stock-based compensation may be considerably less. Simply put, stock-based compensation converts an explicit and easily quantifiable labor cost into an implicit and difficult-to-quantify one. Therefore, the more a company uses it, the more difficult it is to accurately predict its future expenses, earnings, and intrinsic value.
Though many companies love stock-based compensation due to its cash-preserving qualities, it is no friend of the shareholder. While appropriate for some start-ups and early-stage businesses that need help financing operations and incentivizing employee retention, it is less suitable for established firms. If used at all, it should be given modestly, granted only to a handful of executives with company-level responsibility, and tied to measurements of value creation, like return on invested capital or per-share earnings growth, not measurements of empire-building, like total revenue or EBITDA growth. Unfortunately, companies that follow this advice are the exception rather than the rule. But my hope is that, with a better understanding of its characteristics, shareholders will one day push back on the overuse of stock-based compensation.
Performance
During the third quarter of 2024, Kehlet Capital Management’s concentrated micro-cap composite increased 9.67%, roughly in line with the benchmark, which grew 9.25%.
Our largest contribution to performance came from Climb Global Solutions (CLMB), which increased 58.77%. During the third quarter, Climb reported its second-quarter results, which included adjusted gross billings growth (a better proxy for business volume than revenue) of 31.0% and adjusted operating income growth of 20.5%. The company also announced the acquisition of Wisconsin-based IT distributor Douglas Stewart Software & Services, LLC (DSS) for $20.3 million. Not only does DSS provide Climb with meaningful cross-selling opportunities through the addition of 20 new software vendors – including Adobe – but with $5.3M in EBITDA and double-digit growth rates, the acquisition is also expected to be highly accretive. Therefore, given Climb’s strong organic and inorganic growth trends, I expect the strong results to continue for the foreseeable future. The thesis remains intact.
Our largest detractor to performance was Wrap Technologies (WRAP), which declined 25.03%. As a reminder, Wrap is a public safety technology company that makes and sells the BolaWrap 150 remote restraint device. As I wrote in the fourth quarter 2021 newsletter, the investment thesis was threefold: 1) The company created significant value for law enforcement agencies by reducing the costs associated with the use of force. And given BolaWrap’s limited competition and patent protection through 2036, the company would be able to achieve high margins at scale over time. 2) The company had a long growth runway, allowing it to invest capital at high rates of return for many years. And 3) it was run by an exceptional management team that had previously founded a similar, highly successful business called Taser (now known as Axon Enterprise Inc. (AXON)).
A lot has happened since then. First, revenue and gross profit per share have grown by an average of 12.9% and 20.2% over the last three years. Second, the company has had three different CEOs come and go. And third, the company fired its CFO, its independent auditor resigned, and the President of the Company quit. Wrap subsequently fell behind on its financial reporting and received a warning from Nasdaq that it no longer complied with listing requirements. In short, the company has been a bit of a mess.
Admittedly, I have struggled with this name. On the one hand, the fundamentals of the business, though lumpy, have remained strong, and my conviction in the long-term potential has stayed the same. On the other hand, management has been a revolving door, which has almost certainly slowed the company’s progress. In hindsight, I probably should have sold – or at least trimmed – the position when CEO Tom Smith was let go since he was a key part of the thesis. But I still believed in the company and wanted to give new management a chance to prove themselves, which, in my opinion, they did. But then they were soon gone, too. Though selling the position is still an option, I don’t believe I have enough information to make an informed decision. And since the stock is a small portion of the portfolio, the price appears reasonable, and the upside potential remains significant, my plan is to continue holding until more information becomes available or I find a better use of the cash. What I won’t do is keep the stock simply because we already own it, or I am too afraid to admit defeat. Rest assured, I will not hesitate to sell if future indications suggest customers have lost faith in the company and the BolaWrap is no longer being adopted by the market. Until then, the thesis remains battered but not broken. I am hopeful for a speedy recovery.
Portfolio Activity
No adjustments to portfolio weights were made during the quarter.
Conclusion
The third quarter of 2024 was solid from an absolute return perspective and roughly in line with the benchmark. I remain cautiously optimistic about the remainder of the year and am diligently searching for new ideas to add to the portfolio. Thank you again for supporting Kehlet Capital Management. Please do not hesitate to contact me with any questions or comments.
| Number of holdings | 9 |
|---|---|
| Median market cap | $468M |
| Weighted avg. market cap | $359M |
| Climb Global Solutions (CLMB) | 23.0% |
|---|---|
| Fonar Corp. (FONR) | 20.4% |
| Bandwidth Inc. (BAND) | 17.7% |
Notes
Disclosures to Performance Results
Actual composite performance results represent the performance of fully discretionary accounts managed by Kehlet Capital Management (KCM) during the corresponding time period. The composite performance results reflect time-weighted rates of return, the reinvestment of dividends and other account earnings. The reinvestment of dividends and other earnings may have a material impact on overall returns.
Past performance is not indicative of future results and the performance of a specific individual client account may vary substantially from the composite performance results. Therefore, no current or prospective client should assume that future performance will be profitable, or equal either the KCM composite performance results reflected above, or the performance results for any of the comparative index benchmarks provided.
For reasons including variances in portfolio account holdings, variances in the investment management fee incurred, market fluctuations, the date on which a client engages KCM’s investment management services, and any account contributions or withdrawals, the performance of a specific client’s account could vary substantially from the indicated KCM composite performance results. A portion of each account can be actively managed in an attempt to respond to changing conditions.
All performance results have been compiled solely by KCM, are unaudited, and have not been independently verified. Therefore, the performance data could be wrong. Information pertaining to KCM’s advisory operations, services, and fees is set forth in KCM’s current Form ADV Part 2A disclosure brochure, a copy of which is available from KCM upon request.
iShares IWM is an exchange-traded fund (ETF) measuring the performance of approximately 2,000 small-cap companies. It serves as a benchmark for small-cap stocks in the United States.
KCM managed accounts may own assets and follow investment strategies which cause them to differ materially from the composition and performance of the ETF shown as a benchmark. The ETF was chosen for its accessibility, transparency, independence, and relevance to KCM’s investment strategy, but there may be other indices that are more appropriate or applicable to the Concentrated Micro-cap Strategy. The historical index performance results are provided exclusively for comparison purposes only, so as to provide general comparative information to assist an individual client or prospective client in determining whether a specific Portfolio meets, or continues to meet, his/her investment objective(s). It should not be assumed that account holdings will correspond directly to any of the comparative indexes.
Different types of investments and/or investment strategies involve varying levels of risk, and there can be no assurance that any specific investment or investment strategy (including the investments purchased and/or investment strategies devised by KCM) will be either suitable or profitable for a client’s or prospective client’s portfolio and may result in a loss of principal. Accordingly, no client or prospective client should assume that the above portfolios (or any component thereof) serve as the receipt of, or a substitute for, personalized advice from KCM, or from any other investment professional.