
“The heart of successful investing is knowing how to find the minority of stocks that in the years ahead will have spectacular growth in their per-share earnings.”
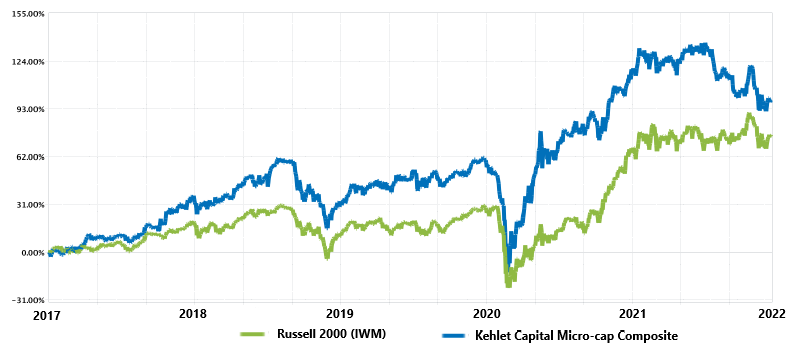
| Year | KCM Composite, Net | IWM | Excess Return |
|---|---|---|---|
| 2017* | 27.20% | 14.26% | +12.94% |
| 2018 | -3.43% | -11.11% | +7.68% |
| 2019 | 27.79% | 25.39% | +2.40% |
| 2020 | 27.52% | 20.03% | +7.49% |
| 2021 | -1.45% | 14.54% | -15.99% |
| Annualized | 14.82% | 12.07% | +2.75% |
*Inception date: 02/01/2017
Introduction
In the previous two newsletters I’ve talked about the importance of return on invested capital (ROIC), the three components of ROIC, and how I evaluate one of those components – margin. In this third and final investing framework newsletter I will discuss the other two components of ROIC – asset turnover and financial leverage – key considerations when assessing a business’s potential long-term ROIC, and where the evaluation of company management fits within this framework.
As a reminder, the expanded ROIC framework looked like this:
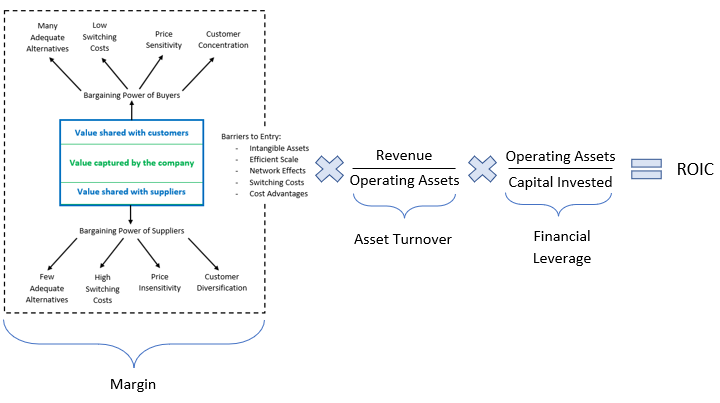
While there is a lot going on in this diagram, the key takeaways are this: the ultimate goal of long-term investors should be to accurately assess a company’s ability to earn excess returns on capital over time. And there are three primary ways for a company to generate excess returns on capital – through margin, asset turnover, or financial leverage. A company’s ability to generate excess returns via any of these three routes is determined by various qualitative factors such as competition, product differentiation, customer switching costs, and price sensitivity. We’ve already discussed the factors that drive margins. Now let’s look at asset turnover.
Asset turnover is the amount of revenue a company earns for every dollar of assets (i.e., property, equipment, buildings, inventory, etc.) it owns. Simply put, it measures how efficiently a business uses its assets to generate revenue. If few assets are required, the business is considered asset-light and more likely to generate high returns on invested capital. But what determines a business’ asset intensity (or lack thereof)? It is largely driven by three factors:
The end-product – That is, if a company’s end-product is asset-intense – like a home or an automobile – its business is likely to be asset-intense as well. The reason is simple; creating a physical asset generally requires even more physical assets. Whereas asset-light products – like software or services – typically require little to no physical assets. Therefore, the more asset-light a product or service is the more likely the business is as well.
The business model – Every business can adjust how asset-light or asset-intense it is through its business model. That is, by outsourcing the most asset-intensive portions of the value chain, a company can move along the spectrum from asset-intense to asset-light. Take Apple Inc. for instance. While the company performs the asset-light functions of its business – such as designing iPhones – in-house, it outsources the asset-intensive portions, like production and assembly, to third parties. In this way, it is able to maintain an asset-light business model even in the most asset-intense portions of the business. It’s important to note however, that the decision to outsource often comes with trade-offs, typically in the form of reduced margins and diminished intellectual property protection. Therefore, outsourcing is generally not appropriate where margins are low and/or intellectual property is a critical competitive advantage.
The efficiency of operations – The more efficient a business is at creating, distributing, and selling its products, the higher it’s asset turnover will be. Take Wal-Mart for example. Although the company is not intuitively asset-light – it owns stores, trucks, warehouses, inventory, etc. – its operations are highly efficient due to its scale, long-standing focus on continuous improvement, and high-volume, high-frequency product offering (i.e., everyone regularly needs groceries). And it’s this efficiency that allows the company to achieve high asset turnover despite owning a significant amount of assets.
By evaluating the three factors above, an investor can get a sense for the asset intensity of a business and its ability to generate high asset turnover. But there is one more way for a company to achieve excess ROIC and that is through financial leverage.
Financial leverage can be thought of as the amount of external capital (i.e., debt or equity) needed to finance one dollar of assets. In other words, if a company needs to purchase $1 million of equipment, how much money would it have to raise to fund the purchase? But that question is nonsense, right? Doesn’t $1 million of assets require $1 million of external capital? Not necessarily. Because sometimes companies can finance their assets with cash generated internally from customers and suppliers. This is primarily accomplished in three ways:
Customer prepayment – This occurs when a customer is willing to pay ahead of time for service to be delivered at some point in the future. Subscription-based businesses like Costco are a perfect example of this. Since customers pay upfront for access to Costco’s stores, but only use their membership gradually throughout the year, the company can use the subscription fee in the interim to acquire inventory, build new stores, and purchase equipment. In essence, the subscription model gives Costco access to interest-free financing and helps increase the company’s return on invested capital. These kinds of businesses can typically be identified by large deferred revenue balances on their balance sheets.
A negative cash conversion cycle – The cash conversion cycle is a measure of how long it takes a business to convert the cash spent to produce its product into cash generated from customers. In other words, how long will cash be locked up before it comes back as revenue? This can often take anywhere from a few days to several months. But sometimes the cash conversion can be negative. That is, in some instances, companies will sell and deliver a product that it has not yet paid its suppliers for. For instance, if Costco were to pay its suppliers in 30 days for inventory that customers paid for immediately, it would have a negative cash conversion cycle and thus additional interest-free financing.
Capital lock-up – This mainly applies to the banking industry, where customers give companies access to their money in exchange for banking services. In the meantime, banks will lend this money out and earn a spread on the difference in interest rates. In essence, it becomes a free or very low-cost source of financing for banks, which depend on significant amounts of financial leverage.
In short, anytime a business can obtain low- or no-cost financing from its customers or suppliers, it can improve its financial leverage and thus its returns on invested capital.
Now that we have explored all three aspects of ROIC – margin, asset turnover, and financial leverage – it is important to understand how they all fit together. So, here are some things to consider when analyzing a business’s ROIC holistically:
First, competitive advantage can produce excess returns on capital via any of the three components of ROIC, not just margin.
Second, the three components are interconnected. A change in one often leads to a change in another. And management can adjust the overall mix through their choice of strategy and business model.
Third, quantitatively, this framework can help determine what a company’s competitive advantage has been historically. Qualitatively, it can help investors understand what it might be in the future. Both elements are important, but the latter is essential for long-term investors.
And fourth, the quantitative and qualitative analyses should mesh. That is, if a company’s competitive advantage is believed to be strong and growing, ROIC should be high and increasing. And if competitive advantage is thought to be weak and declining, ROIC should be low and decreasing. There are exceptions to this rule, but if the quantitative and qualitative analyses don’t match up it’s important to understand why.
Finally, where does company management fit in to this framework? The short answer is everywhere. Management can affect nearly every aspect of ROIC. They can affect margins by how aggressively they price the company’s products, how effectively they control costs, and what future products they choose to bring to market. They can impact asset turnover by choosing which portions of the business to outsource and how efficiently they manage operations. And they can influence financial leverage by how they negotiate payment terms with customers and suppliers. That is why good management is so crucial. Because if ROIC is the most important metric for long-term investors, management is arguably the most important factor in determining long-term ROIC. While I have talked about identifying great management in the third quarter 2018 newsletter, I will save the more in-depth discussion for another time.
Over the last few newsletters, I have laid out my framework for investing, how I analyze businesses, and what I believe separates the great ones from the rest. Hopefully the discussion has been useful, whether to aid in future stock research or to gain clarity into my investment process. It was certainly valuable for me to put my thoughts on paper. So, thank you for bearing with me these last few quarters. And if you have any feedback, either positive or negative, please do not hesitate to reach out.
Performance
During the fourth quarter of 2021, Kehlet Capital Management’s concentrated micro-cap composite decreased 2.70%, underperforming the benchmark which increased 2.00%.
Our largest contribution to performance for the fourth quarter and full year 2021 came from Wayside Technology Group, Inc. (WSTG), which returned 31.18% and 88.88%, respectively. As a reminder, Wayside is an information technology (IT) software distributor of new and emerging technologies. In the fourth quarter of 2020 I laid out my investment thesis for the company, which argued that it would succeed because of its unique position in the market and management’s proven ability to execute. And 2021 provided a great start to the thesis as the company reported several accomplishments, including:
Growing revenue by 15.0% and adjusted income from operations by 56.2% through the first nine months of the year (full year results have not yet been reported).
Adding exciting new vendors like TidalScale, an industry leader in software-defined server technology that helps configure virtual servers. In other words, the company “does to the (server) rack, what VMWare did to the motherboard.” Given the success that VMWare has achieved – it is valued at $52 billion at the time of this writing – TidalScale’s upside appears enormous. And if it accomplishes even half the success of VMWare, it could be a game-changing partner for Wayside.
Launching a new cloud marketplace that allows the company to sell vendor software through a cloud-based subscription model rather than an on-premise, perpetual license. Though the company initially launched the platform with 7 vendors, it has 14 more in the pipeline and expects the cloud marketplace to “play a key role in the future of (Wayside’s) distribution strategy”.
Due, in part, to these accomplishments, the company’s valuation, which was highly attractive a year ago, improved from roughly 13x TTM earnings to approximately 17x TTM earnings. While the stock no longer appears cheap, it does seem far from overvalued. And since I believe the long-term potential of the company remains bright, it is currently our second largest position.
The largest detractor to performance in the fourth quarter was a new position initiated in the third quarter called Wrap Technologies, Inc. (WRAP), which declined 33.25%. Wrap is a public safety technology company that makes and sells the BolaWrap 100 remote restraint device. The BolaWrap 100 is a handheld tool for police officers that restrains uncooperative subjects without the use of force or pain compliance. It discharges an eight-foot Kevlar cord which wraps around a suspect, temporarily restrains them, and gives law enforcement time to safely move-in and make an arrest. In short, the BolaWrap 100 is like deploying handcuffs from a safe distance. And by de-escalating situations without the use of violence, it is safer for both subjects and officers. Though still relatively new, the device has been successfully deployed in the field numerous times. In fact, bodycam footage can be viewed on the company’s website at www.wrap.com/bodycam.
The investment thesis for Wrap is threefold. First, the company creates significant value for customers (i.e., law enforcement agencies) by de-escalating situations that would otherwise require the use of force. This allows police agencies to avoid the significant costs associated with the use of force, including physical harm to officers, subjects, and bystanders as well as claims of police misconduct. In fact, the cost for claims against police is over $300 million per year in cities with the largest police forces.2 This represents a significant opportunity for Wrap just in the U.S., not to mention internationally. And given the company’s one-of-a-kind technology, lack of direct competition, and patent protection through at least 20363, I believe it will capture a large portion of the value it creates over time (i.e., earn high margins at scale).
Second, Wrap has a long runway for growth. For instance, while the company has made substantial progress penetrating the law enforcement market, despite its short history – its first product was launched in 2018 – it still has a long way to go. Today, the BolaWrap 100 is used by over 3,000 officers at roughly 600 U.S. agencies. But this represents a tiny fraction of the 900,000 police officers and ~18,000 agencies in the U.S. and more than 12 million officers globally. Therefore, I believe the company will continue growing at above average rates (i.e., investing capital at high rates of return) for many years to come.
And third, it is run by an exceptional management team led by CEO Tom Smith. Tom co-founded TASER International (now Axon Enterprise, NASDAQ: AXON), a company focused on non-lethal weapons to control suspects and invented the first commercially successful taser. He spent the next 19 years helping build TASER into a highly successful business, which today is valued at over $9 billion. Simply put, there may be no one more ideally suited to lead Wrap Technologies than Tom Smith. In addition, company management has significant “skin in the game” with high insider ownership. For example, BolaWrap inventor, Elwood “Woody” Norris, owns nearly 17% of the shares outstanding while co-founder and Executive Chairman Scot Cohen owns more than 13% of the stock. This suggests that management not only believes strongly in the company but is aligned with shareholders. Consequently, I believe that Wrap’s current management has the integrity, motivation, and skill to lead the company to success and drive long-term shareholder value.
Our largest detractor to performance for the full year 2021 was Bandwidth, Inc. (BAND), which declined 53.00%. In last quarter’s newsletter I talked about the divergence between Bandwidth’s headline organic growth and its “true” organic growth, which adjusted for abnormal events like COVID-19 and the 2020 presidential election. I noted that the decline in Bandwidth’s stock price would be warranted if one focused solely on the company’s steep decline in reported organic growth but unjustified based on adjusted organic growth, which was consistent with historical results. And this divergence between reported and adjusted growth continued into the fourth quarter. The good news is that we are one step closer to the lifting of the financial fog and the company’s true results becoming clear. But patience is still essential as the fog is likely to remain for at least one more quarter. But when it finally lifts, I believe the subsequent long-term returns will be well worth the wait. As result, the stock remains our third largest position.
Portfolio Activity
In the fourth quarter, I reduced our position in Iradimed (IRMD) and used the capital to finish building a position in Wrap Technologies, Inc. (WRAP) as well as add to our position in Bandwidth, Inc. (BAND). No other adjustments to portfolio weights were made during the quarter.
Conclusion
Fourth quarter and full year performance was disappointing. Although I believe performance is best evaluated over a minimum three-year time-period (but preferably five), my goal is to outperform across all market environments. And I was unable to accomplish that in 2021. While frustrating in the short-term, I remain encouraged about the long-term prospects of the portfolio. That may sound cliché, but in this case, it is the absolute truth. Because I believe our portfolio consists of long-term opportunities rarely seen outside of market disruptions. While it’s difficult to predict when performance will improve, I do believe better days are ahead. I want to thank all KCM clients for the patience you have shown throughout the year. As always, thank you for supporting Kehlet Capital Management, and please do not hesitate to contact me should you have any questions or comments.
| Number of holdings | 10 |
|---|---|
| Median market cap | $734M |
| Weighted avg. market cap | $1,138M |
| Fonar Corp. (FONR) | 19.6% |
|---|---|
| Wayside Technologies (WSTG) | 13.2% |
| Bandwidth Inc. (BAND) | 12.8% |
Notes
- * The expanded ROIC framework in last quarters newsletter incorrectly used the term “fixed assets”. Here it has been updated to the more accurate term “operating assets”. ↩
- Carrega, Christina, “Millions in lawsuit settlements are another hidden cost of police misconduct, legal experts say”, ABC News, https://abcnews.go.com/US/millions-lawsuit-settlements-hidden-cost-police-misconduct-legal/story?id=70999540 ↩
- Based on twenty years from the filing date for patent #10,036,615, “Entangling projectile deployment system” ↩
Disclosures to Performance Results
Actual composite performance results represent the performance of fully discretionary accounts managed by Kehlet Capital Management (KCM) during the corresponding time period. The composite performance results reflect time-weighted rates of return, the reinvestment of dividends and other account earnings. The reinvestment of dividends and other earnings may have a material impact on overall returns.
Past performance is not indicative of future results and the performance of a specific individual client account may vary substantially from the composite performance results. Therefore, no current or prospective client should assume that future performance will be profitable, or equal either the KCM composite performance results reflected above, or the performance results for any of the comparative index benchmarks provided.
For reasons including variances in portfolio account holdings, variances in the investment management fee incurred, market fluctuations, the date on which a client engages KCM’s investment management services, and any account contributions or withdrawals, the performance of a specific client’s account could vary substantially from the indicated KCM composite performance results. A portion of each account can be actively managed in an attempt to respond to changing conditions.
All performance results have been compiled solely by KCM, are unaudited, and have not been independently verified. Therefore, the performance data could be wrong. Information pertaining to KCM’s advisory operations, services, and fees is set forth in KCM’s current Form ADV Part 2A disclosure brochure, a copy of which is available from KCM upon request.
iShares IWM is an exchange-traded fund (ETF) measuring the performance of approximately 2,000 small-cap companies. It serves as a benchmark for small-cap stocks in the United States.
KCM managed accounts may own assets and follow investment strategies which cause them to differ materially from the composition and performance of the ETF shown as a benchmark. The ETF was chosen for its accessibility, transparency, independence, and relevance to KCM’s investment strategy, but there may be other indices that are more appropriate or applicable to the Concentrated Micro-cap Strategy. The historical index performance results are provided exclusively for comparison purposes only, so as to provide general comparative information to assist an individual client or prospective client in determining whether a specific Portfolio meets, or continues to meet, his/her investment objective(s). It should not be assumed that account holdings will correspond directly to any of the comparative indexes.
Different types of investments and/or investment strategies involve varying levels of risk, and there can be no assurance that any specific investment or investment strategy (including the investments purchased and/or investment strategies devised by KCM) will be either suitable or profitable for a client’s or prospective client’s portfolio and may result in a loss of principal. Accordingly, no client or prospective client should assume that the above portfolios (or any component thereof) serve as the receipt of, or a substitute for, personalized advice from KCM, or from any other investment professional.