
“Not everything that can be counted counts, and not everything that counts can be counted.”
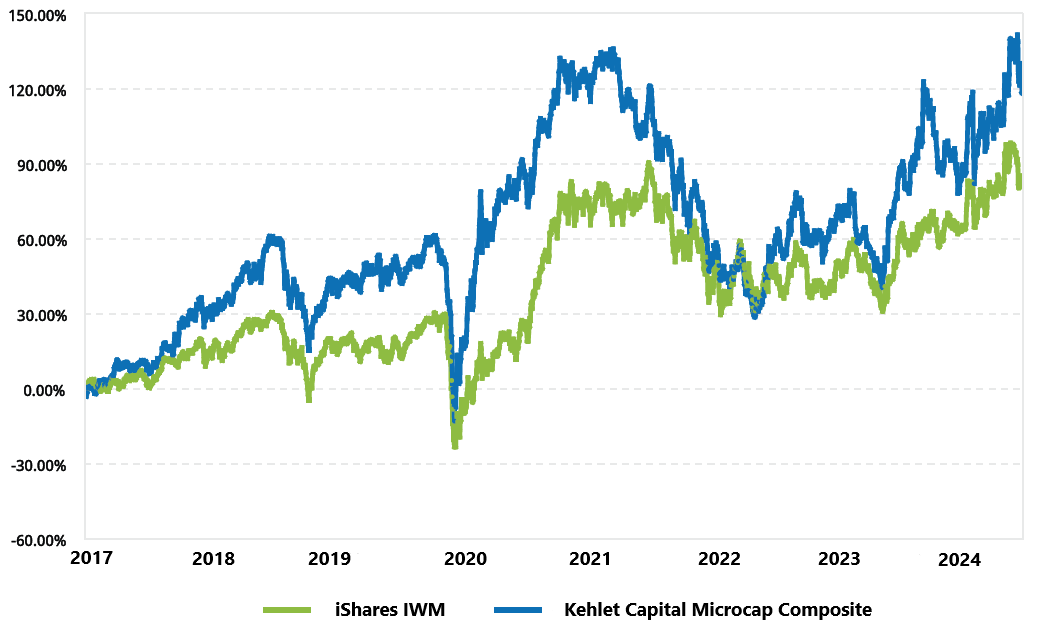
| Year | KCM Composite, Net | IWM | Excess Return |
|---|---|---|---|
| 2017* | 27.20% | 14.26% | +12.94% |
| 2018 | -3.43% | -11.11% | +7.68% |
| 2019 | 27.79% | 25.39% | +2.40% |
| 2020 | 27.52% | 20.03% | +7.49% |
| 2021 | -1.45% | 14.54% | -15.99% |
| 2022 | -22.63% | -20.48% | -2.15% |
| 2023 | 23.12% | 16.84% | +6.28% |
| 2024 | 15.29% | 11.39% | +3.90% |
| Annualized | 10.25% | 7.80% | +2.45% |
*Inception date: 02/01/2017
Introduction
This newsletter has a lot to cover, so I will skip straight to performance.
Performance
During the fourth quarter of 2024, Kehlet Capital Management’s concentrated micro-cap composite increased 5.21%, outperforming the benchmark, which grew 0.33%. For 2024, Kehlet Capital Management’s concentrated micro-cap composite increased by 15.29%, outperforming the benchmark, which grew by 11.39%.
Our largest contribution to performance for the quarter and full year came from Climb Global Solutions (CLMB), which increased 28.17% and 132.10%, respectively. During the fourth quarter, Climb reported its third-quarter results, which included adjusted gross billings growth of 65.0% (36.0% organically) and adjusted operating income growth of 158.1%. The company’s strong performance was driven by the acquisition of Douglas Stewart Software & Services (DSS) and double-digit organic growth in the U.S. and Europe. During the quarter, Climb positioned itself for future growth by selectively adding four new vendors – out of 29 evaluated – to its line card. Simply put, Q3 marked another quarter of solid execution against the company’s organic growth initiatives and value-enhancing M&A strategy. Given management’s track record and the company’s unique position in the IT market, I expect the strong results to continue into the foreseeable future. The thesis remains intact.
Our largest detractor to performance for the quarter was Astronics Corp. (ATRO), which declined 18.07%. During the fourth quarter, Astronics reported its third-quarter results, which included revenue growth of 25.0%, adjusted gross profit growth of 94.8%, and adjusted operating profit of $19.6M – up from a loss of $0.1M in the same quarter last year. Though results were strong, one item likely hurt the stock during the quarter – an unfavorable ruling by a UK court in a long-running patent-infringement lawsuit. While damages have yet to be determined – and Astronics has reserved $7.4 million to cover anticipated costs – the plaintiff is seeking up to $105 million, excluding interest. As a result, Astronics raised $165 million in a convertible note offering to prepare for the worst-case scenario. Although such an outcome would have a material impact on the business – it would represent nearly 20% of the company’s ~$550 million market cap and more than 115% of its TTM adjusted EBITDA of $91 million – it’s important to note a few things:
This lawsuit has been going on since 2010, and the damages hearing is likely to be followed by a lengthy appeals process. Therefore, it could be several more years before the company is required to pay any damages.
Though the plaintiff is seeking up to $105 million, the results of this case in other jurisdictions suggest the final ruling will be much lower. For example, in the U.S., the case was resolved in 2017, with the court finding the patent invalid. The patent was also found invalid in France, though the plaintiff is appealing the decision. And in Germany, though the court upheld some patent claims and found Astronics to be infringing, the company has thus far paid only $3.5 million in penalties and interest while taking a $17.3 million reserve to cover estimated damages.
Even in a worst-case scenario, a $105+ million judgment would not affect the company's long-term viability, as it has ample liquidity and improving profitability to cover the associated costs. Additionally, the lawsuits do not restrict Astronics’ current business activities, and the patents have long expired.
That said, an adverse verdict would impact the company’s future cash flows and, therefore, its valuation. Consequently, I updated my valuation models and attempted to factor in the risk of a negative outcome. The result was a slightly lower intrinsic value estimate and a reduced target weighting in the portfolio. However, the company has strong near-term momentum and is projecting continued growth into Q4 and 2025. In the long term, Astronics maintains a dominant market share with long-term growth potential. As such, the thesis remains intact.
Our largest detractor to performance for 2024 was FONAR Corp. (FONR), which declined 22.60%. During the fourth quarter, Fonar reported its fiscal first quarter results, which included a decline in revenue of 3.4% and a drop in operating income of 29.9%. Though the results were worse than expected, the weakness was likely temporary as it was primarily related to business interruptions at several facilities in Florida caused by Hurricane Helene. Despite the short-term negative results, the long-term trend in MRI scan volumes remained positive. In addition, the company grew its net tangible asset value during the quarter by 2.9% sequentially and 7.4% year-over-year despite investing in MRI scanning capacity and repurchasing shares.1. As a result, Fonar’s net tangible asset value is now approximately 45% higher than its stock price. While the gap between price and value is perplexing, I believe it exists because the market is failing to account for more than $8.00 per share in cash on the company’s balance sheet. If Fonar were to put the cash to work by accelerating its share repurchases, issuing a special dividend, announcing an accretive acquisition, or increasing its capital reinvestment, the gap between price and value could close quickly. Though predicting the timing and magnitude of any capital allocation decision is essentially speculation, I believe it is not a question of if the money gets put to work but when – because no business exists to grow its cash balance ad infinitum. And when it does, I expect the stock price to adjust rapidly to reflect the company’s actual value. Therefore, as long as Fonar’s intrinsic value continues to grow at a reasonable rate, the thesis remains intact.
Portfolio Activity
During the fourth quarter, I trimmed our position in Climb Global Solutions (CLMB) due to valuation concerns, closed out our positions in LeMaitre Vascular (LMAT), Topgolf Callaway Brands (MODG), and Wrap Technologies (WRAP), and redeployed the capital into a new position, which I will discuss in next quarter’s newsletter.
I closed out our position in Topgolf Callaway Brands (MODG) due to the company’s deteriorating fundamentals and overvaluation relative to my estimate of intrinsic value. Callaway’s decline in fundamentals began around its acquisition of Topgolf in March 2021. Though the market was high on Topgolf and its potential, I was skeptical of the value it would create for shareholders. Despite the company’s optimistic projections, I could never make the math work to achieve a reasonable return on investment. So, I sold most of our stock between November 2020 and August 2022 for an average price of $23.93 per share.
However, I continued to hold a small position in the portfolio in case my assumptions proved too conservative and the business achieved better-than-expected operating leverage over time. Though the company showed significant improvement over the next couple of years due to a rebound from COVID-19, the return on invested capital remained subpar. Then, beginning in the third quarter of 2023, Topgolf’s same venue sales started to decline. Over the next several quarters, same venue sales fell from -3% in Q3 2023 to -11% last quarter. As a result, the already poor returns on invested capital became even more insufficient. With better opportunities to deploy the capital elsewhere in the portfolio, I sold our remaining position for $8.41 per share. Though the price fell dramatically over the last few years, our returns over the entirety of our holding period were highly satisfactory due to favorable position sizing. During the nearly eight years we owned the stock, it provided an annualized return of 25.9% compared to an annualized return of 8.4% for the benchmark.
I closed out our LeMaitre Vascular (LMAT) position entirely due to valuation concerns. I began acquiring shares of LeMaitre between August 2017 and June 2020 for an average cost of $28.72. At the time, the company had adjusted earnings per share of approximately $1.19, resulting in a price-to-earnings ratio (P/E) of around 24x.2 LeMaitre would grow its adjusted earnings per share by more than 68% (almost 14% annualized) to roughly $2.00 per share over the next four years. But its stock price would rise even faster, increasing nearly 255% to $101.95 per share. The result was a P/E that ballooned to almost 51x, far above my intrinsic value estimate. However, during the more than seven years we owned LeMaitre Vascular, it provided an annualized return of 18.6% compared to an annualized return of 8.9% for the benchmark.
Finally, I closed our Wrap Technologies (WRAP) position due to a broken thesis and serious concerns about the new management team. In last quarter’s newsletter, I discussed the situation at Wrap. I noted, “I will not hesitate to sell if future indications suggest customers have lost faith in the company and the BolaWrap is no longer being adopted by the market.” And during the fourth quarter, that is precisely what happened. For example, the company reported financial results, which included a drop in revenue of 83.7%, a decline in gross profit of 89.2%, and continued operating losses. With revenue down 34.3% over the first nine months of 2024 on top of a 23.8% decline in 2023, the results represented the continuation of an alarming trend since current management took over.
Additionally, the company announced it had paused manufacturing to “focus on monetizing a $25 million finished goods inventory”. But there were two problems with this statement: 1) It reinforced the notion that future demand would be weak and suggested that Wrap was no longer a growth company, and 2) it was flat-out wrong – the company’s 10-Q filing showed $4.5 million in finished goods inventory on the balance sheet, not $25 million. While I understand that mistakes happen (although this one has yet to be corrected), the nature of this error leads me to believe that management is either deceitful, incompetent, or both. Either way, it is a management team and business I am no longer comfortable investing in. Consequently, I sold our remaining shares for an average price of $1.38. During the more than three years we owned Wrap Technologies, it provided an annualized return of -40.1% compared to an annualized return of 2.3% for the benchmark.
This is a highly discouraging result, but the key lesson I learned is this: exercise more caution when dealing with speculative opportunities. With Wrap, I had conviction in the qualitative aspects of the business – its potential to save lives, the company’s patent-protected competitive advantage, and the former CEO’s track record with Axon Enterprise (AXON). So, I was willing to bet on the company’s future profitability despite certain quantitative aspects of the business – namely, its minimal gross profit and history of operating losses. However, downplaying a company’s fundamentals in favor of a narrative makes an investment inherently riskier. I still believe risky opportunities with significant upside potential can be attractive. But in the future, for those types of investments, I plan to start with a smaller position and gradually increase (or decrease) its weight in the portfolio as the business proves it can (or cannot) execute. Though this approach reduces the potential upside, I believe it is more than offset by the downside protection attained.
Conclusion
The fourth quarter and full year 2024 were solid from both an absolute and relative return perspective. I made several changes to the portfolio, which I believe will position us well heading into 2025. I remain highly optimistic about our portfolio’s long-term potential and continue searching for new ideas to enhance returns further. Thank you again for supporting Kehlet Capital Management. Please do not hesitate to contact me with any questions or comments.
| Number of holdings | 7 |
|---|---|
| Median market cap | $500M |
| Weighted avg. market cap | $340M |
| Fonar Corp. (FONR) | 18.1% |
|---|---|
| Climb Global Solutions (CLMB) | 17.9% |
| Bandwidth Inc. (BAND) | 16.4% |
Notes
Disclosures to Performance Results
Actual composite performance results represent the performance of fully discretionary accounts managed by Kehlet Capital Management (KCM) during the corresponding time period. The composite performance results reflect time-weighted rates of return, the reinvestment of dividends and other account earnings. The reinvestment of dividends and other earnings may have a material impact on overall returns.
Past performance is not indicative of future results and the performance of a specific individual client account may vary substantially from the composite performance results. Therefore, no current or prospective client should assume that future performance will be profitable, or equal either the KCM composite performance results reflected above, or the performance results for any of the comparative index benchmarks provided.
For reasons including variances in portfolio account holdings, variances in the investment management fee incurred, market fluctuations, the date on which a client engages KCM’s investment management services, and any account contributions or withdrawals, the performance of a specific client’s account could vary substantially from the indicated KCM composite performance results. A portion of each account can be actively managed in an attempt to respond to changing conditions.
All performance results have been compiled solely by KCM, are unaudited, and have not been independently verified. Therefore, the performance data could be wrong. Information pertaining to KCM’s advisory operations, services, and fees is set forth in KCM’s current Form ADV Part 2A disclosure brochure, a copy of which is available from KCM upon request.
iShares IWM is an exchange-traded fund (ETF) measuring the performance of approximately 2,000 small-cap companies. It serves as a benchmark for small-cap stocks in the United States.
KCM managed accounts may own assets and follow investment strategies which cause them to differ materially from the composition and performance of the ETF shown as a benchmark. The ETF was chosen for its accessibility, transparency, independence, and relevance to KCM’s investment strategy, but there may be other indices that are more appropriate or applicable to the Concentrated Micro-cap Strategy. The historical index performance results are provided exclusively for comparison purposes only, so as to provide general comparative information to assist an individual client or prospective client in determining whether a specific Portfolio meets, or continues to meet, his/her investment objective(s). It should not be assumed that account holdings will correspond directly to any of the comparative indexes.
Different types of investments and/or investment strategies involve varying levels of risk, and there can be no assurance that any specific investment or investment strategy (including the investments purchased and/or investment strategies devised by KCM) will be either suitable or profitable for a client’s or prospective client’s portfolio and may result in a loss of principal. Accordingly, no client or prospective client should assume that the above portfolios (or any component thereof) serve as the receipt of, or a substitute for, personalized advice from KCM, or from any other investment professional.