
“I always thought that if you looked at ten companies, you’d find one that’s interesting. If you looked at 20, you’d find two. If you looked at 100, you’d find ten. The person that turns over the most rocks wins the game.”
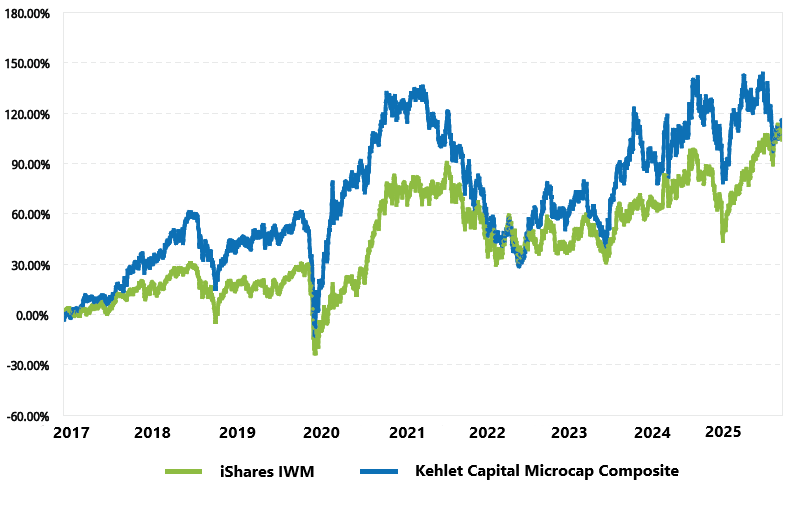
| Year | KCM Composite, Net | IWM | Excess Return |
|---|---|---|---|
| 2017* | 27.20% | 14.26% | +12.94% |
| 2018 | -3.43% | -11.11% | +7.68% |
| 2019 | 27.79% | 25.39% | +2.40% |
| 2020 | 27.52% | 20.03% | +7.49% |
| 2021 | -1.45% | 14.54% | -15.99% |
| 2022 | -22.63% | -20.48% | -2.15% |
| 2023 | 23.12% | 16.84% | +6.28% |
| 2024 | 15.29% | 11.39% | +3.90% |
| 2025 | -1.08% | 12.66% | -13.74% |
| Annualized | 8.92% | 8.33% | +0.59% |
*Inception date: 02/01/2017
Introduction
In the Kehlet Capital Management 3rd quarter 2023 newsletter, I talked about a project I was working on to automate most of my financial data and analysis. I used the tool I had built over the next year and was pleased with the results. It effectively highlighted promising new ideas and made initial research quicker and more efficient. However, I noted several opportunities for improvement. Notably, I wanted the tool to provide deeper, more insightful analysis, more automation, and a cleaner user interface. The problem was that I had very limited programming skills. So, I turned to A.I. for help. After consulting with ChatGPT, I decided to move the data storage from Microsoft Excel to an SQL server hosted on Amazon Web Services. With significant help from ChatGPT, I then created Python and PostgreSQL scripts to download the data, organize it, and perform various calculations. Finally, I used Tableau to visualize the data and perform further analysis. The result has been a significant improvement in my ability to find and evaluate ideas more efficiently.
For example, the first interesting stock I came across while working on this project was BJ’s Restaurants Inc. (BJRI). The company owns and operates 218 full-service restaurants in 31 states. What initially attracted me to the idea was that the business had increasing returns on invested capital, was growing faster than its historical average, but was trading below its historical average valuation. As I researched the company further, I discovered that 1) profitability had been increasing but was yet to return to pre-COVID levels – suggesting an opportunity for continued growth, 2) a new CEO had recently been hired and was implementing several positive changes to the business, and 3) results had noticeably improved since the new CEO took over. I reasoned that, with initiatives underway at the company, BJ’s profit margins could easily return to pre-COVID levels, which would more than double earnings per share over the next year or two. Given the already discounted valuation, the stock seemed to represent a highly attractive risk-reward tradeoff. Therefore, I initiated a position in September 2025 at an average price of $31.57 per share. At the time of this writing, the stock trades at $44.05, up nearly 40% in just over four months. Needless to say, I am excited about the potential impact the new and improved data automation tool will have going forward.
Finally, in previous newsletters, I’ve talked about overall market valuation using a chart of the Shiller Cyclically Adjusted Price-to-Earnings (CAPE) ratio. Though I don’t make individual portfolio decisions based on the overall market (aside from how much cash to hold), it is helpful to understand the current landscape. Therefore, I will include the following chart in all future newsletters to provide readers with more context.
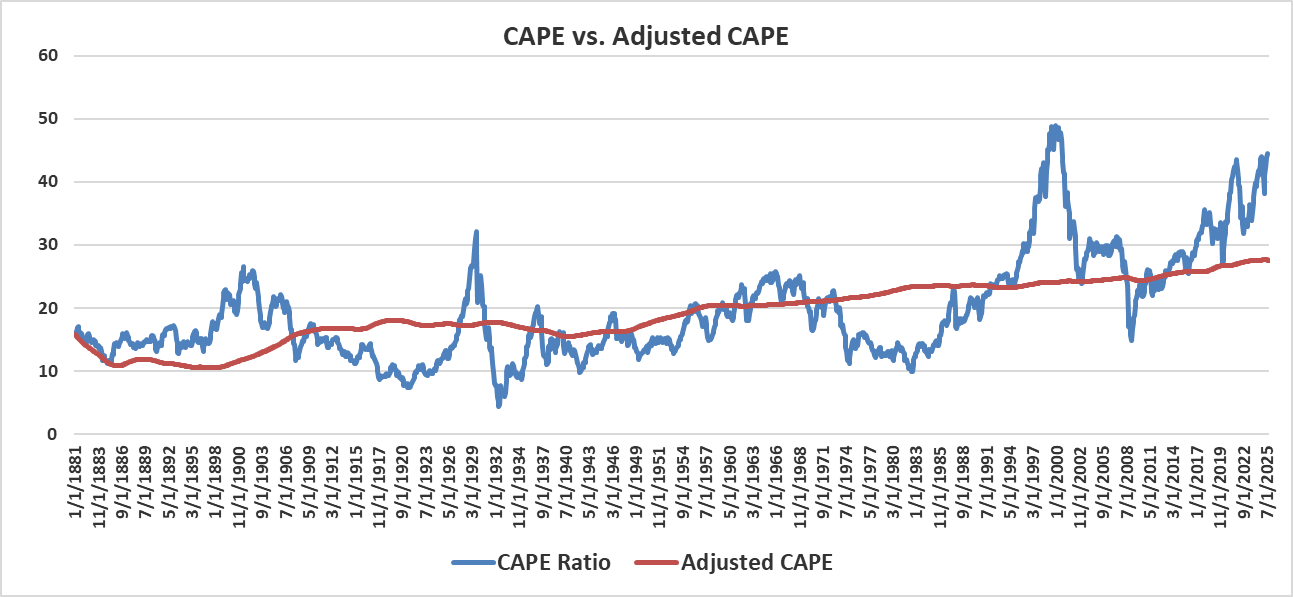
The blue line is the CAPE ratio over the last 150 years, and the red line is my estimate of fair value based on historical averages of interest rates, equity risk premiums, and corporate earnings growth. When the blue line is above the red line, it suggests the market is overvalued. When it is below the red line, it implies the market is undervalued. As you can see, we are currently at extremely elevated levels. But, as I’ve noted in the past, bubbles are very difficult to predict and can last for many years. For instance, the current “bubble” has been more than 10 years in the making.
Though I believe our portfolio can do well in any market, our skew toward high-quality, reasonably priced companies means relative performance will struggle when a bubble is inflating, but should do exceedingly well when prices correct. As such, I find Kehlet Capital’s performance since inception to be bittersweet. Viewed in isolation, performance relative to the benchmark has not met my expectations. But given the context of inflating valuations, I am also pleased to have kept up as well as we have. Time will tell what happens next, but I continue to believe we are positioned favorably for whatever the future holds.
Performance
During the fourth quarter of 2025, Kehlet Capital Management’s concentrated micro-cap composite decreased 8.12%, underperforming the benchmark, which grew 2.08%.
Our largest contributor to fourth-quarter performance was Fonar Corp. (FONR), which increased by 23.24%. During the fourth quarter, the company signed a definitive agreement to be taken private at $19 per share by a group of investors led by CEO Timothy Damadian. The transaction represents a 31.5% premium to Fonar’s closing share price on the last trading day prior to the announcement and is expected to close in the 3rd fiscal (1st calendar) quarter of 2026.
Our largest detractor to performance for the quarter and full year was Semler Scientific Inc. (SMLR), which declined 49.03% and 71.43%, respectively. In September 2025, Semler announced an agreement to be acquired by Strive Inc. (ASST) in an all-stock transaction. As part of the deal, Semler shareholders would receive 21.05 shares of Strive stock for each Semler share. Based on Strive’s share price at the time, the transaction was valued at $90.52 per share, or a 210% premium to Semler’s stock price. But instead of trading up on the news, Semler’s stock price fell by nearly 50% over the next few months. The problem was twofold: 1) Strive had only recently become a public company, and its shares were trading at a significant premium to the net asset value of the Bitcoin on its balance sheet, while Semler was trading at a discount. In essence, the deal meant that Semler shareholders would be exchanging an undervalued stock for an overvalued one. Therefore, as Strive’s premium fell, the value of Semler’s newly acquired shares fell as well. 2) As leveraged holders of Bitcoin, Semler and Strive tend to amplify Bitcoin’s price swings. When Bitcoin’s price rises, Semler and Strive’s shares rise further, and when Bitcoin falls, Semler and Strive’s shares drop even more. And during the fourth quarter, Bitcoin’s price declined by ~23%, further pressuring Semler and Strive’s stock prices. But despite the decline, Bitcoin’s fundamentals remain strong as adoption grows and the network continues to expand. As a result, I believe the long-term future of both Semler and Strive remains bright.
Our largest contribution to performance for the full year 2025 came from Astronics Corp. (ATRO), which increased 205.47%. During 2025, Astronics continued its strong momentum, increasing revenue by 6.0% over the first nine months of the year and growing adjusted operating income by 77.3%. However, I closed our position in November at $48.10 per share due to valuation concerns.1 The astute reader will note that today, just two months later, Astronics is trading at nearly $75 per share. Though selling the position may seem like a mistake at first glance, there is an important lesson to be gleaned – stock prices are unpredictable and timing their exact top (or bottom) is nearly impossible. The best an investor can do is try to position themselves appropriately for long-term success. And, based on the chart below, Astronics was becoming a risky long-term bet when I sold:
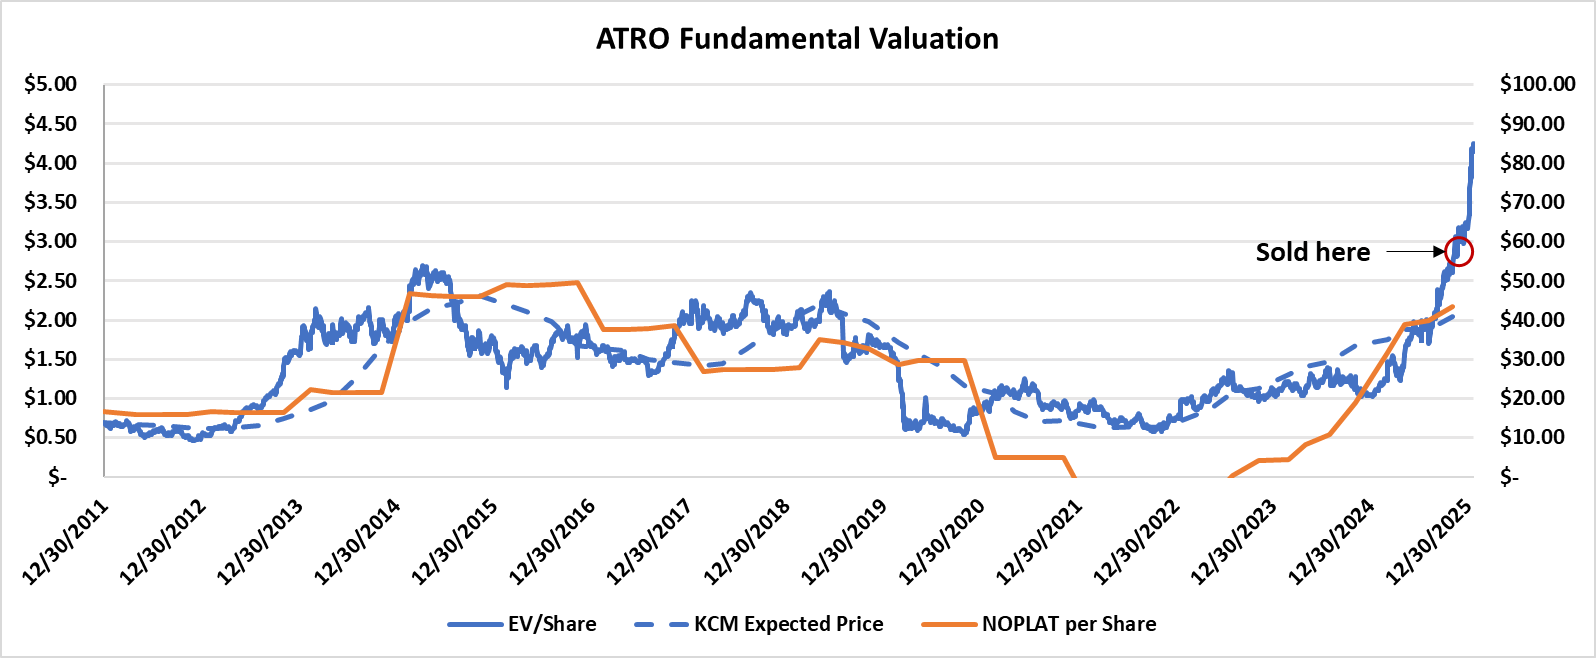
Simply put, any investor entering or exiting a position is bound to look wrong in the short term. But what matters most is being right in the long term. For example, a friend of mine bought Stitch Fix Inc. (SFIX) stock several years ago for $15 a share. When the price quickly increased to $60, he decided to close his position. But then he watched in dismay as the stock continued to rise, eventually hitting $100 per share. Though I’m sure he felt he had made a huge mistake at the time, his decision was ultimately proven correct – today, the stock trades at less than $5 per share.
Portfolio Activity
During the quarter, I exited our position in Astronics Corp. (ATRO) and Iradimed Corp. (IRMD) due to valuation concerns. During the nearly 8 years we owned Astronics, it returned an average of 16.8% annually, compared with 7.6% for the benchmark. During the almost five years we owned Iradimed, it returned an average of 42.9% annually, compared to 6.6% for the benchmark. I redeployed the capital from these stocks into BJ’s Restaurants Inc. (BJRI) and a perpetual preferred stock (SATA), which I will discuss in next quarter’s newsletter. No other adjustments to portfolio weights were made during the quarter.
Conclusion
2025 was disappointing from both an absolute and relative return perspective. Though performance over the last several years has not lived up to my expectations, given an increasingly overheated market, I am quite pleased it has kept up as well as it has. And now that my new data automation tool is beginning to bear fruit, I’m even more optimistic that our portfolio will see outsized returns, regardless of market environment. Thank you again for your support of Kehlet Capital Management. Please do not hesitate to contact me with any questions or comments.
| Equity holdings | 6 |
|---|---|
| Median market cap | $565M |
| Weighted avg. market cap | $268M |
| Fonar Corp. (FONR) | 22.4% |
|---|---|
| Bandwidth Inc. (BAND) | 15.0% |
| Climb Global Solutions (CLMB) | 14.6% |
Notes
- This equates to an enterprise value per share of about $57.15 as shown in the chart on the next page ↩
Disclosures to Performance Results
Actual composite performance results represent the performance of fully discretionary accounts managed by Kehlet Capital Management (KCM) during the corresponding time period. The composite performance results reflect time-weighted rates of return, the reinvestment of dividends and other account earnings. The reinvestment of dividends and other earnings may have a material impact on overall returns.
Past performance is not indicative of future results and the performance of a specific individual client account may vary substantially from the composite performance results. Therefore, no current or prospective client should assume that future performance will be profitable, or equal either the KCM composite performance results reflected above, or the performance results for any of the comparative index benchmarks provided.
For reasons including variances in portfolio account holdings, variances in the investment management fee incurred, market fluctuations, the date on which a client engages KCM’s investment management services, and any account contributions or withdrawals, the performance of a specific client’s account could vary substantially from the indicated KCM composite performance results. A portion of each account can be actively managed in an attempt to respond to changing conditions.
All performance results have been compiled solely by KCM, are unaudited, and have not been independently verified. Therefore, the performance data could be wrong. Information pertaining to KCM’s advisory operations, services, and fees is set forth in KCM’s current Form ADV Part 2A disclosure brochure, a copy of which is available from KCM upon request.
iShares IWM is an exchange-traded fund (ETF) measuring the performance of approximately 2,000 small-cap companies. It serves as a benchmark for small-cap stocks in the United States.
KCM managed accounts may own assets and follow investment strategies which cause them to differ materially from the composition and performance of the ETF shown as a benchmark. The ETF was chosen for its accessibility, transparency, independence, and relevance to KCM’s investment strategy, but there may be other indices that are more appropriate or applicable to the Concentrated Micro-cap Strategy. The historical index performance results are provided exclusively for comparison purposes only, so as to provide general comparative information to assist an individual client or prospective client in determining whether a specific Portfolio meets, or continues to meet, his/her investment objective(s). It should not be assumed that account holdings will correspond directly to any of the comparative indexes.
Different types of investments and/or investment strategies involve varying levels of risk, and there can be no assurance that any specific investment or investment strategy (including the investments purchased and/or investment strategies devised by KCM) will be either suitable or profitable for a client’s or prospective client’s portfolio and may result in a loss of principal. Accordingly, no client or prospective client should assume that the above portfolios (or any component thereof) serve as the receipt of, or a substitute for, personalized advice from KCM, or from any other investment professional.