
“You can’t predict. You can prepare.”
| Year | KCM Composite, Net | IWM | Excess Return |
|---|---|---|---|
| 2017* | 27.20% | 14.26% | +12.94% |
| 2018 | -3.43% | -11.11% | +7.68% |
| 2019 | 27.79% | 25.39% | +2.40% |
| 2020 | 27.52% | 20.03% | +7.49% |
| 2021 | -1.45% | 14.54% | -15.99% |
| 2022 | -22.63% | -20.48% | -2.15% |
| 2023 | 23.12% | 16.84% | +6.28% |
| 2024 | 15.29% | 11.39% | +3.90% |
| 2025 | -1.08% | 12.66% | -13.74% |
| YTD 2026 | 67.79% | 13.65% | +54.14% |
| 1 Year | 54.17% | 16.00% | +38.17% |
| 5 Years | 12.14% | 6.21% | +5.93% |
| Since Inception | 14.15% | 9.10% | +5.05% |
*Inception date: 02/01/2017. Returns are through 9/30/2026. 5-year and since-inception returns are annualized.
Introduction
In February 2027, Kehlet Capital Management (KCM) will celebrate its tenth anniversary. That makes this a natural time to look back and evaluate the firm’s long-term performance to date.
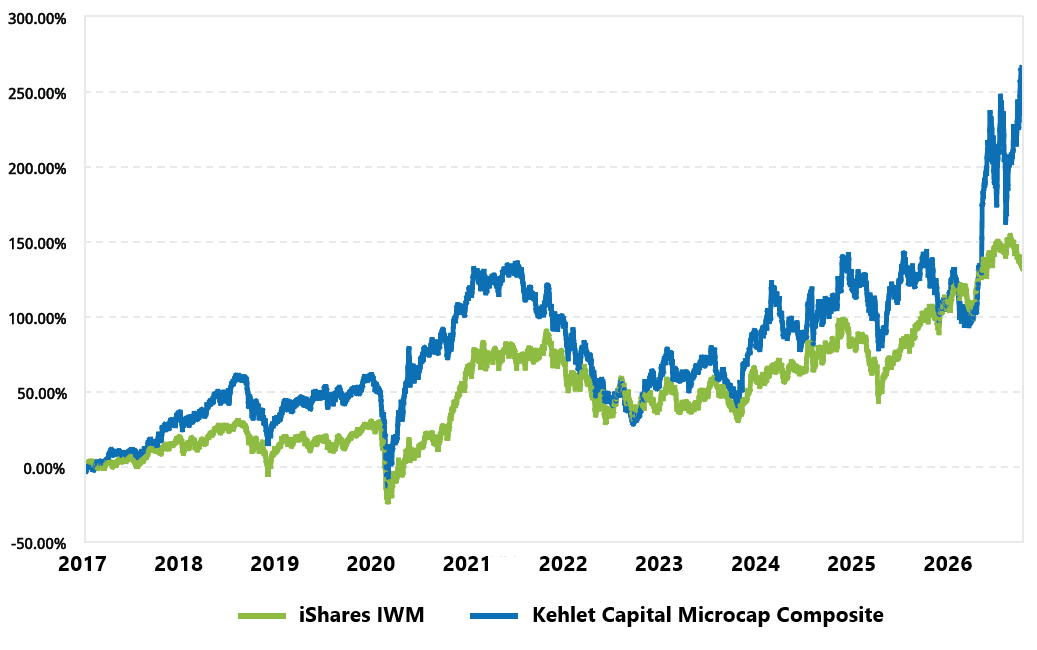
As the table above shows, KCM’s concentrated micro-cap strategy achieved a compound annual growth rate of 14.15% after fees since inception, compared with 9.10% for the benchmark1. Though the path has not always been smooth, the result has been highly satisfactory based on the value created for clients.
As Kehlet Capital enters its second decade, the question I find myself asking is, “Do I believe I can achieve similar outperformance over the next ten years?” The short answer is “I do.” Obviously, I am biased, the future is unpredictable, and past performance is not a guarantee of future results. Still, over the last ten years, I have learned a great deal about managing the portfolio and refined the investment process along the way. Technology has become a bigger part of the work, too. With the help of AI, I’ve built a data automation tool that handles most of my data gathering and analysis. It speeds up research and helps surface new ideas. As a result, I feel as good as ever about the strategy’s long-term potential. Most of all, I hope the years ahead will be as prosperous for clients as the first ten!
Market Valuation
The two charts below, based on KCM analysis, show how the overall stock market is valued today:
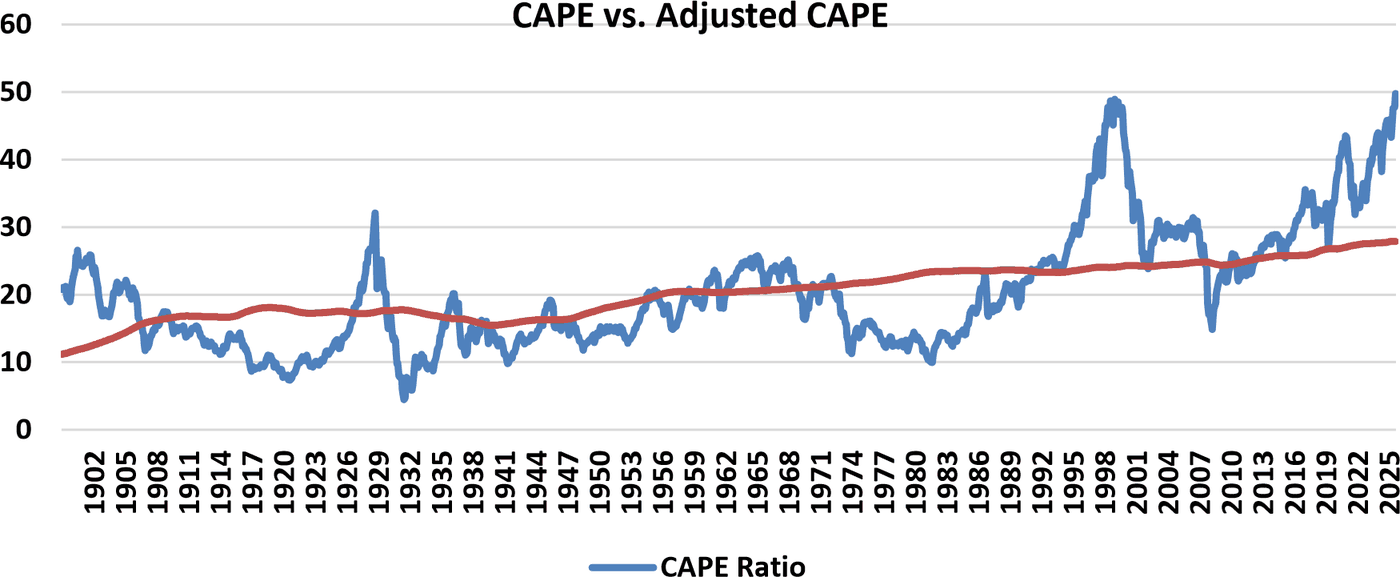
In the first chart, the blue line is the CAPE ratio, which compares the market’s price with average company profits over the past ten years. The red line is my estimate of fair value, based on historical averages of interest rates, equity risk premiums (the extra return investors expect for owning stocks instead of Treasury bonds), and corporate earnings growth.
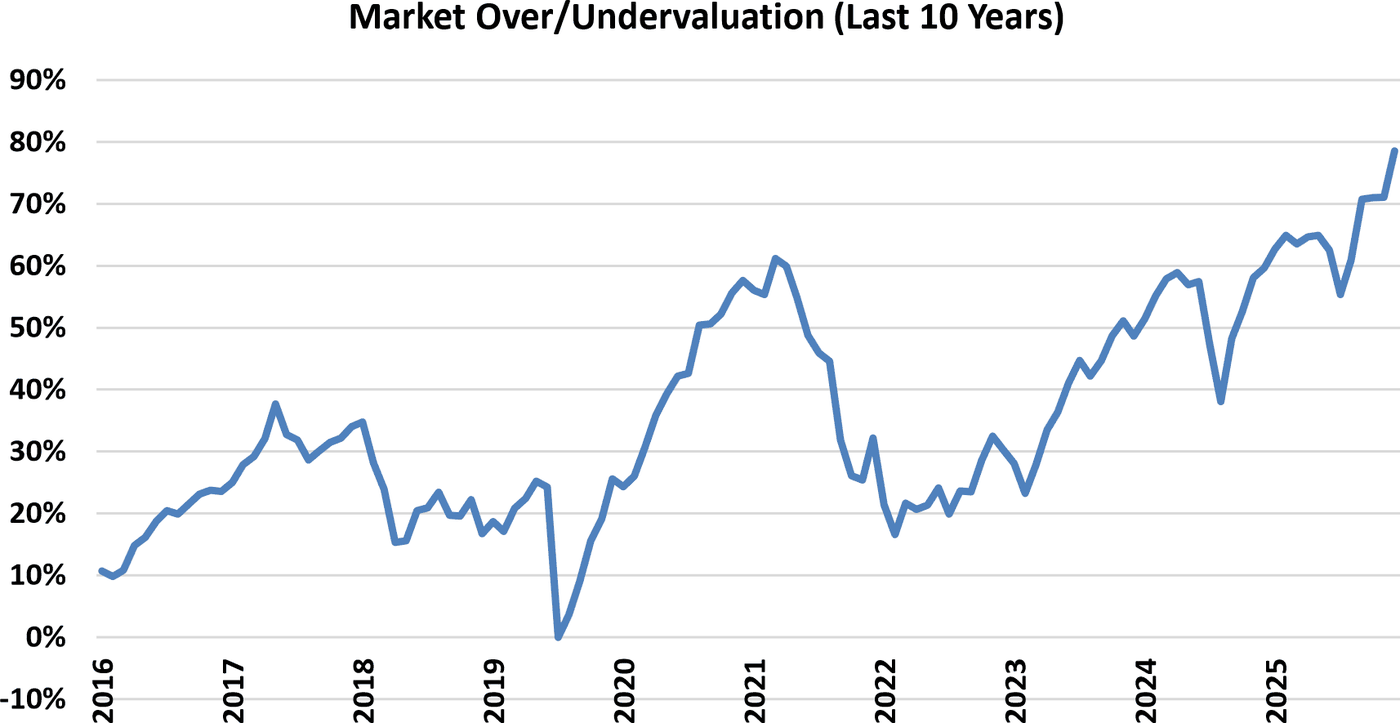
The second chart tracks how far the market has traded above or below that estimate since 2016. The gap kept growing this quarter. In last quarter’s letter, my analysis put the market about 73% above fair value. In the latest data, the figure is about 79%. The market’s overall level doesn’t dictate which stocks I choose to buy, but it does guide how much cash we hold. Therefore, with overall valuations stretching further, I increased our cash position during the quarter, as explained in the Portfolio Activity section later in the newsletter.
Performance
During the third quarter of 2026, Kehlet Capital Management’s concentrated micro-cap composite increased by 18.43%, outperforming the benchmark, which fell by 7.27%.
Our largest contributor to third-quarter performance was Strive Inc. (ASST), which increased 169.41%. The main driver was Bitcoin, which rose about 43% during the quarter, from roughly $58,600 to $83,600. Strive sells preferred stock, which pays a dividend and ranks ahead of common shareholders. Strive uses that money to buy more Bitcoin, so each common share is backed by more Bitcoin than it would be otherwise. As a result, the stock tends to magnify Bitcoin’s moves in both directions, and this quarter that dynamic worked in our favor. Strive also added to its Bitcoin treasury holdings, buying 8,137 bitcoin between July and September. By October 9, it owned 32,773, which made it the fifth-largest Bitcoin holder among public companies.
Shortly after the quarter ended, on October 13, Strive announced plans to raise $500 million through an initial public offering of a second preferred stock, called SATS. SATS works much like Strive Inc.’s Variable Rate Series A Perpetual Preferred Stock (SATA), which we already own. Both have a $100 stated value, pay a dividend every business day, and never mature. They are also cumulative, meaning missed dividends pile up and must be paid before common shareholders receive any. There are three key differences. SATS pays a fixed 15% a year, while SATA’s rate is variable (13% today). SATS stands behind SATA in line for dividends and in a liquidation, though still ahead of the common stock. And unlike SATA, whose rate is adjusted to keep it trading near $100, SATS has no price target and can trade freely.
Strive gave two main reasons for adding a second preferred. The first was demand. Many income investors, including retirees, want a dividend that won’t change, and some worry that SATA’s variable rate could fall over time. At the same time, many large institutions want a security whose price can rise. And given that roughly 93% of bonds pay a fixed rate, Strive saw these as indications of how much demand SATS could generate. The second reason was to give the company flexibility. Since Strive has promised never to sell new SATA shares below $100, and SATA has only traded at or above that level on 24% of trading days since its IPO, the company has been limited in how often it can raise money. But because SATS has no price target, Strive can sell new shares more often than SATA and keep adding Bitcoin to its balance sheet.
Because we own both Strive’s common stock and SATA, the SATS offering matters to us in two ways. First, it will cost Strive 15% a year, and the money it raises will buy more Bitcoin. As long as Bitcoin grows faster than that over time, the extra gain goes to common shareholders. If it grows more slowly, they absorb the shortfall. While 15% might sound like a high hurdle to clear, it is well within the company’s (and my) base case scenario. Second, SATS gives SATA a cushion. Since SATS ranks behind SATA, the new money adds to the assets backing SATA. Strive estimates that after the IPO, it will have about $2.54 in Bitcoin, cash, and other holdings for every $1 of SATA, up from about $2.18 today. As such, Bitcoin would have to fall by about 70% before SATA’s obligations would no longer be fully covered.
Why is Strive so confident in Bitcoin? Its case rests mainly on the U.S. dollar. Government debt keeps growing, and long-term borrowing costs have risen with it. When Strive recorded its presentation, the interest rate on 10-year U.S. government bonds stood at 5.24%. Strive expects policymakers to eventually push rates down, and it believes the cost of doing so will be a weaker dollar. The company notes that Bitcoin’s biggest rallies have come when the dollar was falling, and that Bitcoin has never lost value over any four-year stretch. For my own view on Bitcoin, you can watch the talk I gave at the Chicago Shoreline Symposium in January, which is posted on the Kehlet Capital website. No one knows for sure what Bitcoin will do next, and its price will likely stay volatile. But Strive has no recourse debt and holds enough cash to cover about 18 months of preferred dividends. In my opinion, this gives the company meaningful room to ride out price swings and the thesis remains intact.
Our largest detractor to performance was Bandwidth Inc. (BAND), which declined 4.11%. But during the third quarter, the company reported strong second-quarter results. Revenue grew 22% from a year earlier to $220 million. Adjusted EBITDA (earnings before interest, taxes, depreciation, amortization, stock-based pay, and some one-time items) rose 27% to $28 million, and management raised its outlook for the full year. Bandwidth also signed or expanded agreements worth more than $1 million a year each with five customers, including one of the giant cloud-computing companies. Investors, however, focused on management’s expectation that growth would slow in the second half of the year. The company called that estimate conservative because it leaves out revenue from Bandwidth’s newest large deals, including a partnership with Salesforce. Then, in September, Salesforce expanded that partnership, naming Bandwidth the first certified carrier for the worldwide rollout of Salesforce’s AI-powered contact center. The rollout will start with more than 25 countries across Europe, the U.K., Australia, and New Zealand. After a run-up like the one Bandwidth had in the second quarter, a partial pullback is common. However, the business keeps growing, and the long-term thesis remains intact.
Portfolio Activity
During the quarter, I sold our position in BJ’s Restaurants Inc. (BJRI) due to valuation concerns. BJ’s was the first idea I found using the data automation tool described in my letter for the fourth quarter of 2025. I bought our shares in September 2025 at an average cost of $31.57 per share and sold them in August 2026 at $68.09. Over our roughly 11-month holding period, BJ’s returned 115.69%, compared to 28.11% for the benchmark. Though the company’s results had improved meaningfully since we established our position, at $68 a share, I felt investors were paying even more than I was comfortable with. While I still like the business and would gladly own the stock again, it would need to trade at a much more attractive price for that to happen.
I also trimmed our holding in SATA to increase our cash position and reduce overall risk in the portfolio. SATA is a useful place to earn a 13% yield on excess cash, but it is still a stock. If the market or Bitcoin fell sharply, SATA’s price would likely drop with them. And as the earlier charts showed, overall valuations are high and rising. At these levels, I prefer to keep more money in reserve than usual, in case the market reverses. So, in August, I sold about a third of our shares in SATA at $98.11 each. Together with the BJ’s sale, this raised our cash position from about 4% of the portfolio at the start of the quarter to about 13% at the end.
Firm Update
For the first ten years of Kehlet Capital, the fee has been 1% a year. However, starting next year, I will be changing it for the first time. Going forward, the fee for any new client that joins the firm on or after January 1, 2027, will be 1.50% on the first $1 million in their account, 1.25% on the portion between $1 million and $5 million, and 1.00% on the portion above $5 million. If you are a client today, or join before the end of the year, nothing changes. Your fee stays at 1.00% on every account you have now or open later. I believe the people who trusted me early should keep the terms they signed up for.
As a result of the fee change, however, the historical net returns I report will be revised downward starting with my next letter. They will reflect a fee of 1.50% a year, the top rate for new clients, instead of the 1.00% fee clients currently pay. This only changes how past results are shown, not what any client actually earned. I will also update the firm’s Form ADV Part 2A with the new schedule before it takes effect, and a copy will be available on request.
Conclusion
The third quarter of 2026 was a strong one. Most of the quarter’s gain came from Strive and our other Bitcoin-related holdings. While these positions can drop as quickly as they climb, I try to size them with that in mind. And with market valuations high and rising, I raised cash during the quarter to provide us with the option to be opportunistic if the market pulls back. Lastly, as the firm approaches its tenth anniversary, I am grateful to every client who has trusted me along the way. Thank you for your continued confidence in Kehlet Capital Management. As always, I welcome your questions and am happy to discuss the portfolio anytime.
| Equity holdings | 5 |
|---|---|
| Median market cap | $1,954M |
| Weighted avg. market cap | $1,200M |
| Bandwidth Inc. (BAND) | 35.5% |
|---|---|
| Strive Inc. (ASST) | 14.0% |
| Climb Global Solutions (CLMB) | 10.9% |
Notes
- As of September 30, 2026 ↩
Disclosures to Performance Results
Actual composite performance results represent the performance of fully discretionary accounts managed by Kehlet Capital Management (KCM) during the corresponding time period. The composite performance results reflect time-weighted rates of return, the reinvestment of dividends and other account earnings. The reinvestment of dividends and other earnings may have a material impact on overall returns. Net returns reflect the deduction of advisory fees of 1% a year.
Past performance is not indicative of future results and the performance of a specific individual client account may vary substantially from the composite performance results. Therefore, no current or prospective client should assume that future performance will be profitable, or equal either the KCM composite performance results reflected above, or the performance results for any of the comparative index benchmarks provided.
For reasons including variances in portfolio account holdings, variances in the investment management fee incurred, market fluctuations, the date on which a client engages KCM’s investment management services, and any account contributions or withdrawals, the performance of a specific client’s account could vary substantially from the indicated KCM composite performance results. A portion of each account can be actively managed in an attempt to respond to changing conditions.
All performance results have been compiled solely by KCM, are unaudited, and have not been independently verified. Therefore, the performance data could be wrong. Information pertaining to KCM’s advisory operations, services, and fees is set forth in KCM’s current Form ADV Part 2A disclosure brochure, a copy of which is available from KCM upon request.
iShares IWM is an exchange-traded fund (ETF) measuring the performance of approximately 2,000 small-cap companies. It serves as a benchmark for small-cap stocks in the United States.
KCM managed accounts may own assets and follow investment strategies which cause them to differ materially from the composition and performance of the ETF shown as a benchmark. The ETF was chosen for its accessibility, transparency, independence, and relevance to KCM’s investment strategy, but there may be other indices that are more appropriate or applicable to the Concentrated Micro-cap Strategy. The historical index performance results are provided exclusively for comparison purposes only, so as to provide general comparative information to assist an individual client or prospective client in determining whether a specific Portfolio meets, or continues to meet, his/her investment objective(s). It should not be assumed that account holdings will correspond directly to any of the comparative indexes.
Different types of investments and/or investment strategies involve varying levels of risk, and there can be no assurance that any specific investment or investment strategy (including the investments purchased and/or investment strategies devised by KCM) will be either suitable or profitable for a client’s or prospective client’s portfolio and may result in a loss of principal. Accordingly, no client or prospective client should assume that the above portfolios (or any component thereof) serve as the receipt of, or a substitute for, personalized advice from KCM, or from any other investment professional.